Recoil proton reconstruction
The studies were based on two MC samples provided by Liping:
- gamma p -> p eta (pi0 + 2gamma)
- gamma p -> p pi0
Each sample contained 50k events. Generated events were processed through a Geant simulation and were reconstructed using the recent GlueX reconstruction code (sim-recon-2011-07-31).
gamma p -> p eta decays
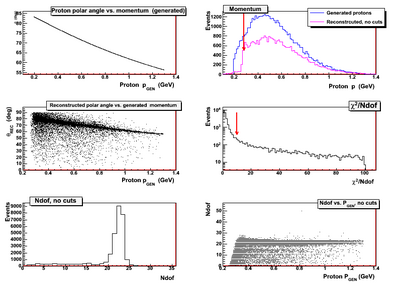
- Recoil proton kinematics
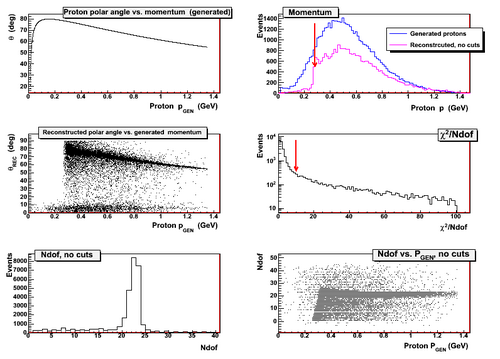
- Proton polar angle versus momentum for generated events (top left)
- Momentum distributions for generated and reconstructed protons as a function of the generated momentum (top right)
- Polar angle of reconstructed protons as a function of the generated proton momentum (middle left)
- Chisq/Ndof for reconstructed protons (middle right)
- Ndof distribution (bottom left)
- Ndof versus proton momentum (bottom right)
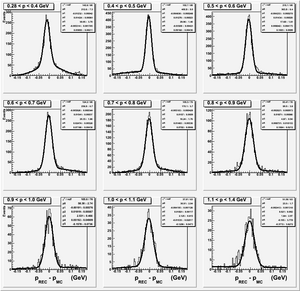
- Proton momentum residuals
p(rec) - p(gen) as a function of the genarted proton's momentum.
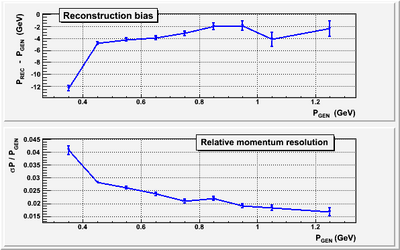
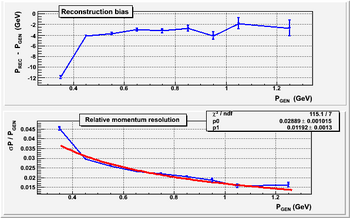
- Momentum resolution and reconstruction bias
- Reconstruction bias (top). The mean value of residual distributions, < p_rec - p_gen >, as a function of the proton generated momentum, p_gen.
- Energy resolution dp/p (bottom).
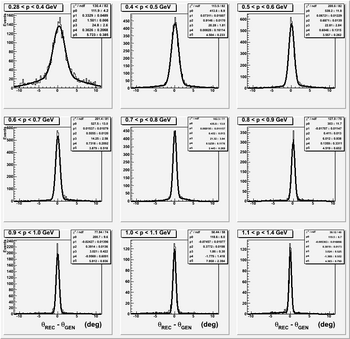
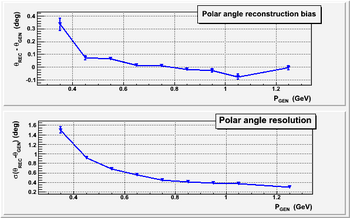
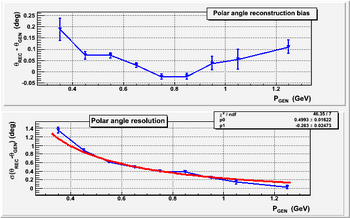
- Polar angle of reconstructed protons
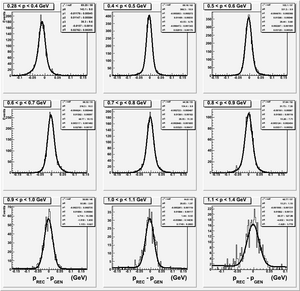
- Residuals, theta_rec - theta_gen (left plot).
- Polar angle resolution (right plot):
- < theta_rec - theta_gen >, as a function of the generated proton momentum, p_gen (top)
- sigma(theta) in degrees (bottom)
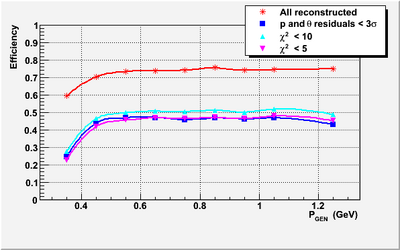
- Proton reconstruction efficiency
- Red curve represents efficiency for events where a proton candidate track is found.
- Blue curve corresponds to events with |p_rec - p_gen| < +-3 sigma and
|theta_rec - theta_gen| < +- 3 sigma
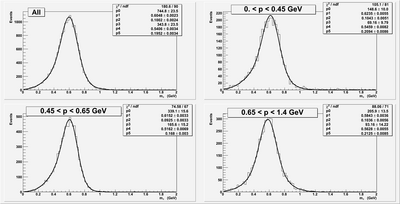
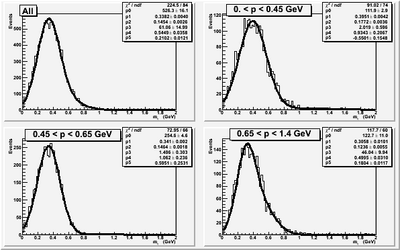
- Eta missing mass distribution
- Missing masses were computed for different momentum ranges of
generated protons. Reconstructed proton tracks were required to satisfy chi2/ndof < 10. The top left plot represents the missing mass distribution for all reconstructed protons.
gamma p -> p pi0 decays
- Recoil proton kinematics
- Proton polar angle versus momentum for generated events (top left)
- Momentum distributions for generated and reconstructed protons as a function of the generated momentum (top right)
- Polar angle of reconstructed protons as a function of the proton generated momentum (middle left)
- Chisq/Ndof for reconstructed protons (middle right)
- Ndof distribution (bottom left)
- Ndof versus proton momentum (bottom right)
- Proton momentum and polar angle resolutions
- Reconstruction bias (top). The mean value of residuals, < p_rec - p_gen >, as a function of p_gen.
- Energy resolution dp/p (bottom). The distribution was fit to the function p1/sqrt(x) + p2
- Reconstruction bias (top). The mean value of residuals, < theta_rec - theta_gen >, as a function of theta_gen.
- Angular resolution sigma(theta) in degrees (bottom). The distribution was fit to the function p1/x + p2
- pi0 missing mass distribution
- Missing masses were computed for different momentum ranges of generated protons. Reconstructed proton tracks were required to satisfy chi2/ndof < 10. The top left plot represents the missing mass distribution of all reconstructed protons.
- Toy MC: pi0 missing mass distributions for various momentum and angular resolutions
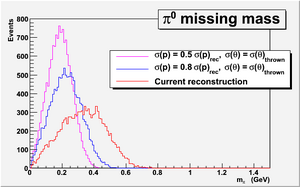
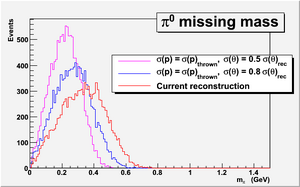
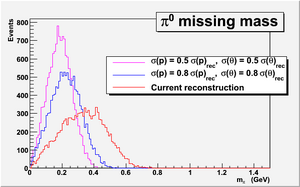 Missing mas was computed for the following cases:
- the value of the proton momentum was set to that of the MC generated (thrown) track. The proton polar angle was smeared accoring to 0.8 sigma and 0.5 sigma, where sigma is the reconstruction resolution shown in the plot above.
- proton polar angle was set to the MC generated value. The proton momentum was smeared according to 0.8 sigma and 0.5 sigma of the niminal momentum resolution.
- both, proton momentum and polar angles were smeared according to 0.8 and 0.5 sigmas.
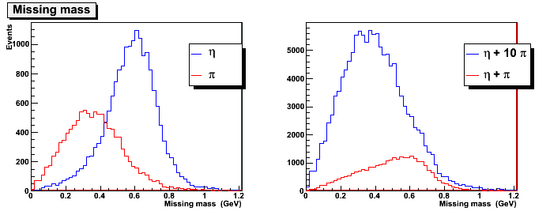
- Missing mass distributions for pi0 and eta
Comparison of missing mass distributions for p pi0 and p eta channels. Each reconstructed MC sample contains 50k events (left plot). Missing mass distributions for MC samples containing:
- 50k eta pi0 and 50k p eta generated events
- 50k p eta and 500k e pi0 events (right plot).
