Solenoid Mapping Results: Aug. 4, 2013
Mapping of the GlueX solenoid magnetic field took place July 31, 2013 to Aug. 4, 2013. Files are located here:
/group/halld-online/Solenoid_Mapping
Contents
Calibrating Hall probe to NMR
At several different currents the 3-axis hall probe was calibrated relative to an NMR probe. These were all one on the center line at the point of the field where it was maximized (so that the gradient was zero making it easier to get the NMR to lock). Below is a plot showing the reading of the z-axis of the 3-axis Hall-probe relative to the NMR probe reading. These come from the spreadsheet "Measurement_Log.xlsx" that is in the above indicated directory alongside the data files.
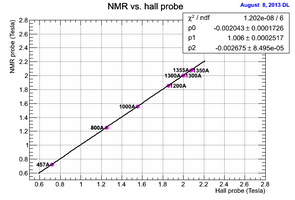
Calibration of Hall-probe using NMR. The data points were fit to a second order polynomial to give some idea of the non-linear component.

Calibration of Hall-probe using NMR. The data points were fit to a second order polynomial but with the constant term fixed at 0. This indicates that at 2T, the Hall probe differs from the NMR probe by only -0.04%.


Probe misalignment
If the field were perfectly symmetric then the radial component of the field along the axis of the magnet would be zero everywhere. If, however, the probe's axis were not perfectly aligned then there would be a systematic error in the measured values of Bz and Br. Assuming all of the measured Br values along the center line of the magnet are due to probe misalignment (which may not be a good assumption) then one can calculate this via arcsin(Br/Bz). This is plotted here as a function of z:
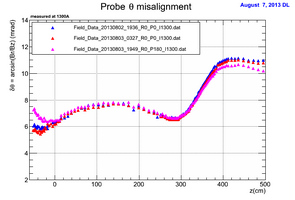
Taken at 1300A. From this, one can estimate that the probe misalignment was not more than about 8 mrad (though it may indicate some misalignment or shift of the last coil.) Based on this, a correction of cos(8 mrad) was applied to the other plots below.

Comparison to calculated field near coils
Near the coils is expected to be the region of greatest disagreement between calculation and measurement. Below are 2 plots showing a comparison of the absolute values of Bz and of their difference for calculated and measured. These were generated from the same map taken at I=1300A , R=32", and φ=135o
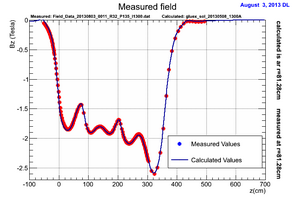
Full Magnitude at R=32"
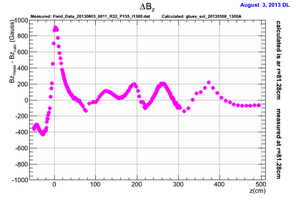
Difference at R=32" (Measured - Calculated)


φ dependence of field
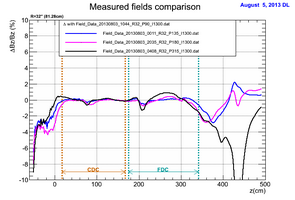
The existence of holes in the iron of the magnet raise the possibility that the azimuthal symmetry of the field may be broken at a level that will require corrections in the data analysis. Lines were mapped parallel to the magnet axis at different φ locations to check the degree of this effect. Here are some plots showing comparisons of measured values at different φ locations. Each plot was at a different radius from magnet center and differences were taken relative to the measurements done at φ=90o.
n.b. The values of Bz were made negative just for comparison to the Poisson maps which have the field in the negative z direction. Because of this, the difference plots in Bz are flipped compared to what you might otherwise expect.
Absolute Differences
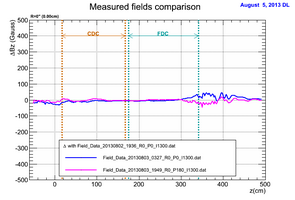
R=0" (these should be identical since in principle the probe was centered on the magnet axis for all measurements)
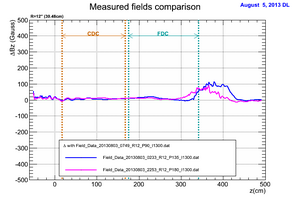
R=12"
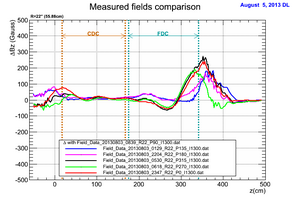
R=22"
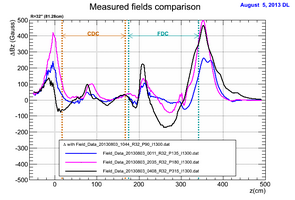
R=32"
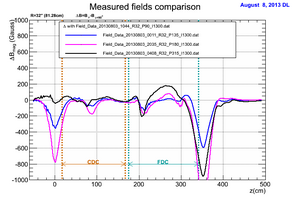
R=32 Total magnitude"


Relative Differences
The relative difference in percent is shown in the following plots
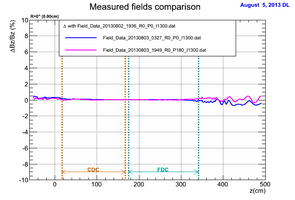
R=0" (these should be identical since in principle the probe was centered on the magnet axis for all measurements)
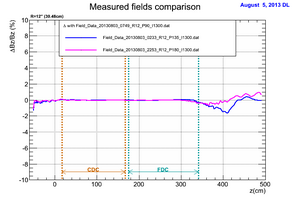
R=12"
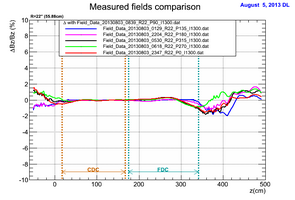
R=22"
R=32"
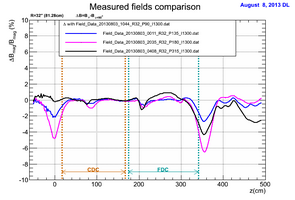
R=32 Total magnitude"


Field Gradients
After mapping finished, there was some question as to what the resolution of the probe position was in the radial direction. This is important when comparing two maps at different φ angles where symmetry says the maps should be identical. To estimate the effect on the map values themselves, gradients of the Poisson-calculated map at 1300A were taken. The plots below show the results in Gauss/cm. A plot of 1/Bz*dBz/dr is also shown to give the percent change in Bz per cm change in R.
dB/dr
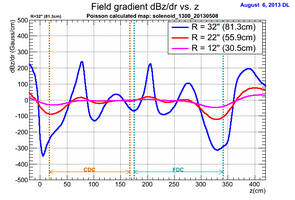
dBz/dr vs. z (Gauss/cm)
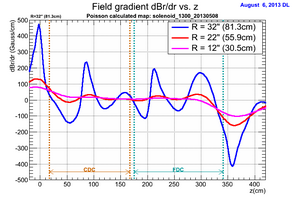
dBr/dr vs. z (Gauss/cm)
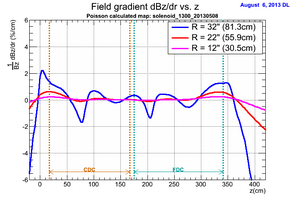
1/Bz * dBz/dr vs. z (percent / cm)


dB/dz
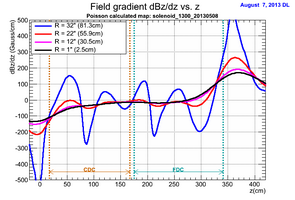
dBz/dz vs. z (Gauss/cm)
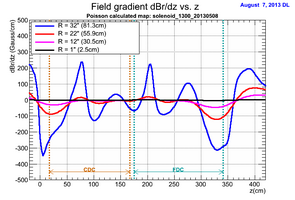
dBr/dz vs. z (Gauss/cm)
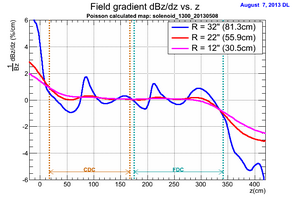
1/Bz * dBz/dz vs. z (percent / cm)


