TOF Performance
TOF Performance
A measure of the TOF performance is the width to the pion  distribution as a function of momentum. The smaller this number the better protons can be separated from pions at higher momenta. It was found that using a single fixed effective velocity for all paddles in the TOF detector yields a better performance then using individual values for this velocity as determined from calibration of the TOF. To demonstrate this the following two plots show the beta of positive particles in TOF with a momentum of 4 GeV/c. The first pictures shows data from run 72840 with database parameters from Jul 2021 where each paddle had a separate velocity while the second plot shows the same data but with a single velocity for all paddles:
Run 72840 with variable effective velocity
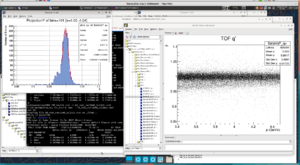
Run 72840 with fixed single effective velocity
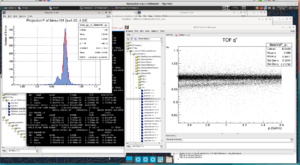
Test with run 72740 and 72840
For yet unknown reasons the TOF resolution based on tracked pion data is significantly worse from most of the run period 2019-11 compared to 2018-08 as is outlined in github issue 807. Only towards the end of the run period the TOF resolution comes back to values of the previous run period.
Below are tests with two runs 72740 showing this bad resolution behavior and run 72840 with the expected good resolution. In the following these two runs are tested with based on TOF performance alone using the same ccdb calibration as during production and the new ccdb values with a single effective velocity.
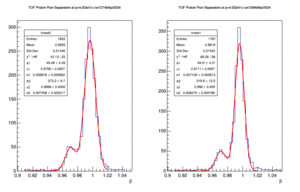
A similar test is done with two runs comparing the timing resolution or separation power between protons on pions at a momentum of 4GeV/c before and after using a single effective velocity.
BEFORE (CCDB July21)
Note the right plot shows the intrinsic TOF performance (TOF timing values only) AND (TOF meant-time values)
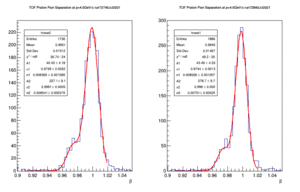
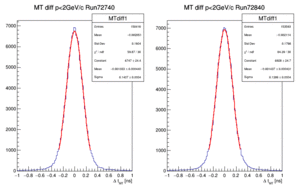
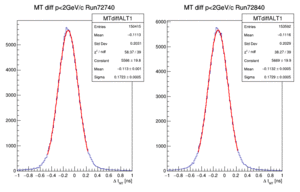
the width of the pion peak is slightly wider for run 72740 by about 3.7% as compared to run 72840 while the resolution difference shown in the github issue is of order 15%.
- There is a about a 20% difference in the width of the pion peak while the width of the proton peaks are very similar.
- proton peak positions: A) 0.9706 and B) 0.9711 (uncertainty less than 0.1%)
- width of the peaks: A)0.006918 and B) 0.007105 (uncertainty about 8.5%)
- pion peak positions: A) 0.9966 and B) 0.996 (uncertainty less than 0.1%)
- width of the peaks: A) 0.007458 and B) 0.006076 (uncertainty order 3%)
- taking pion width to measure separation: A) 3.5
 and B) 4.1
- proton peak positions: A) 0.9706 and B) 0.9711 (uncertainty less than 0.1%)
