Test Setup for SiPMs
From GlueXWiki
Contents
Test of First Article of Hamamatsu SiPMs at JLab
Time Line
- Mid Feb.2011: 10-20pcs partial shipment of first article units
- Mid Mar.2011: Delivery remainder first article units (60-70pcs)
- End Apr.2011: First article approval
- End Jul.2011: 1st delivery 500pcs
- End Aug.2011: 2nd delivery 500pcs
- End Sept.2011: 3rd delivery 120pcs
LabVIEW Programs and Data Directory
Directory
LabVIEW programs and acquired data are stored on sipm_pc.jlab.org in ARC building room 628.
- Directory for LabVIEW programs: C:\SiPM_Test\LabVIEW
- Directory for QDC data: C:\SiPM_Test\Data\QDC
- Directory for instrument's manuals: C:\SiPM_Test\Manuals
- Directory for instrument's drivers: C:\SiPM_Test\Drivers
LabView Programs
- DAQ_Control.vi
-
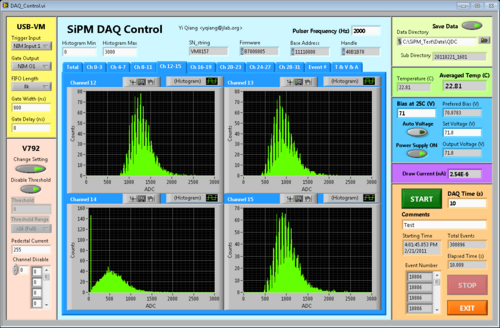
- Performs multi-channel DAQ with V792 VME QDC module
- Data saved in C:\SiPM_Test\Data\QDC and organized with directories named by the starting time
- Each directory contains the following files:
- Settings.txt: settings for the DAQ session
- Raw_Data.txt: raw data file of individual events of active channels, two columns: channel number, ADC channel
- Histo_xxx.txt: individual or stacked histograms of active channels, two columns: ADC channel (0-4095), count
- Readings.txt: readings of voltage, current and temperature during DAQ, five columns: relative time (s), set voltage (V), output voltage (V), draw current (nA), temperature (C)
-
- VI_Curve.vi
-
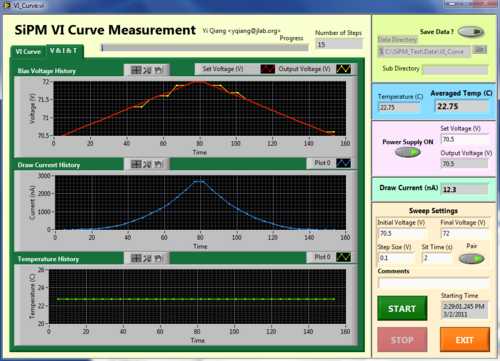
- Performs V-I curve measurement of SiPMs
- Data saved in C:\SiPM_Test\Data\VI_Curve and organized with directories named by the starting time
- Each directory contains the following files:
- Settings.txt: settings for the scan
- Data.txt: readings of voltage, current and temperature during measurement, five columns: relative time (s), set voltage (V), output voltage (V), draw current (nA), temperature (C)
-
Analysis Code
Test Results
- Web page for 1st article test results
- SiPM sample#1: [1]
- MySQL Database:
- server: halldweb1.jlab.org
- port: 3306 (MySQL default)
- username: halld
- password: ask Yi
- Database: halld_sipm
- Tables:
- fist_article_spec: Specifications of first article samples - average properties
- sn: [SMALLINT] Serial Number
- voltage: [DECIMAL(4,2)] Average voltage (V)
- vol_var: [DECIMAL(3,1)] Standard deviation in voltage of individual channels (mV)
- m_var: [DECIMAL(3,1)] Variation of gain (%, from Hamamatsu spec sheet)
- dark_rate: [DECIMAL(4,2)] Total dark rate (MHz)
- dr_var: [DECIMAL(3,1)] Relative standard deviation in dark rate of individual channels (%)
- remark: [CHAR[60]] Remarks
- first_article_tile: Specifications of first article samples - individual channels
- sn: [SMALLINT] Serial Number
- channel: [TINYINT] Channel number (1-16)
- voltage: [DECIMAL(4,2)] Voltage of individual channels for a 7.5×10⁵ gain (V)
- dark_rate: [DECIMAL(3,2)] Dark rate of individual channels (MHz)
- first_article_result: Test results of first article sample - average values
- sn: [SMALLINT] Serial Number
- date: [DATE] Date of measurement
- voltage: [DECIMAL(4,2)] Voltage at 25C (V)
- gate: [DECIMAL(4,0)] ADC Gate (ns)
- dark_rate: [DECIMAL(3,2)] Average dark rate from individual channels(MHz)
- dr_var: [DECIMAL(3,1)] Relative standard deviation in dark rate (%)
- pde: [DECIMAL(3,3)] Average PDE
- pde_var: [DECIMAL(3,1)] Relative standard deviation in PDE (%)
- gain: [DECIMAL(3,2)] Average gain (×105)
- gain_var: [DECIMAL(3,1)] Relative standard deviation in gain (%)
- cross_talk: [DECIMAL(3,3)] Average cross-talk and after pulsing in ADC gate
- ct_var: [DECIMAL(3,1)] Relative standard deviation in cross-talk (%)
- remark: [CHAR[60]] Remarks
- first_article_result_tile: Test results of first article sample - individual channels
- sn: [SMALLINT] Serial Number
- channel: [TINYINT] Channel number (1-16)
- date: [DATE] Date of measurement
- dark_rate: [DECIMAL(3,2)] Dark rate (MHz)
- pde: [DECIMAL(3,3)] PDE
- gain: [DECIMAL(3,2)] Gain (×105)
- cross_talk: [DECIMAL(3,3)] Cross-talk and after pulsing in ADC gate
- sipm_spec: Specifications of production units - average properties
- same structure as first_article_spec
- sipm_spec_tile: Specifications of production units - individual channels
- same structure as first_article_spec_tile
- fist_article_spec: Specifications of first article samples - average properties
- How to use MS Office Access to access MySQL database
- Install MySQL Connector/ODBC 32-bit version: link
- install 32-bit version connector even if your Windows copy is 64-bit
- Open a new database or existing one in MS Office Access
- Link to a ODBC database:
- In Access tool bar, select "External Data" tab
- In the "Import" section, click "More" and then select "ODBC Database"
- In the "Get External Data - ODBC Database" window, choose "Link to the data source by creating a linked table", click "OK"
- In the "Select Data Source" window select "Machine Data Source" tab
- If you haven't created a MySQL data source, follow these steps to create one:
- Click "New...", acknowledge the following warning if you do not have Administrative privilege.
- In the "Create New Data Source" window, select the type of data source preferred, choose "User Data Source" then click "Next>"
- Choose "MySQL ODBC 5.x Driver" then click "Next>", then "Finish"
- In the "MySQL Connector/ODBC Data Source Configuration" Windows, give a new "Data Source Name", type in halldweb1.jlab.org for "TCP/IP Server", halld for "User" and corresponding password. If everything goes correctly, you should be able to select halld_sipm database in the pull-down menu. Click "OK" to finish the configuration.
- Select the Data Source you created for the halld_sipm database, click "OK"
- Select the table(s) you want to access then click "OK"
- You can now operate the MySQL database through Access
- Install MySQL Connector/ODBC 32-bit version: link
Test Items and Instruments Needed
General Devices
- Central Machine: SiPM_PC.jlab.org (129.57.72.17) Windows 7 computer with LabVIEW 2009 SP1 installed (USB)
- VME controller: Wiener VM-USB DLL Driver (USB to VME)
- QDC: CAEN V792 Example (VME)
- Oscilloscope: Tektronix TPO4104 Driver (RS232,USB,Ethernet)
- Temperature sensor: Go!Temp Driver (USB)
- Low voltage power supply: multiple output
- Bias voltage power supply: B&K 1787B Driver (RS232)
- Pulse Generator: HP 8116A Driver (GPIB)
- Picoamp Meter: Keithley 485 Driver (GPIB)
- Programmable Electrometer Keithley 617 Driver (GPIB)
Gain (being tested, all done)
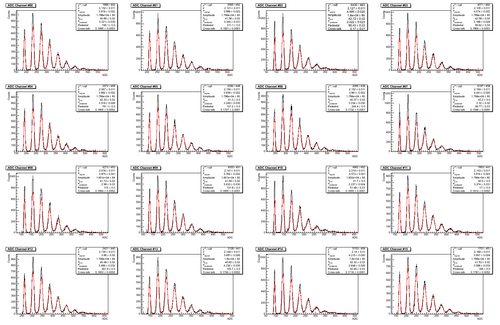
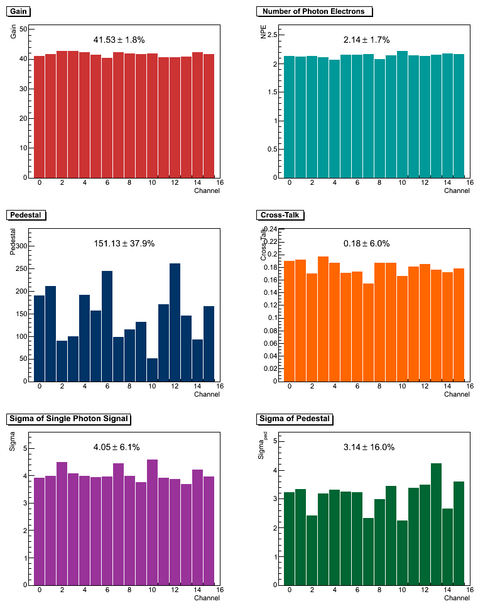
- Measure ADC spectrum w. or w./o light source
- Measure distance between peaks, calculate the corresponding charge and then gain
Photo Detection Efficiency (PDE) (being tested, all done)
- Continuous method (DC mode): overestimated due to cross-talk and after pulsing
- Measure draw current with calibrated light input
- Divide current by gain and photon flux to get "PDE"
- Pulse mode
- Measure ADC spectrum triggered by calibrated pulse light source
- Fit the spectrum by the function derived here to extract detected number of photons and cross-talk/after pulsing
- Divide the detected number of photons by input to get PDE
Cross-Talk/After Pulsing
- Cross-Talk and After Pulsing are sometimes mixed, in this context they are defined base on the timing:
- Cross-Talk means fast secondary signals which happen almost simultaneously with the primary signal which are likely due to the secondary photon generated by the primary signal leaked to adjacent pixels.
- After Pulsing means slow secondary signals which happen after the primary signal which are likely due to the delayed release of trapped electrons.
- Threshold method
- Pure measurement with dark noise
- This method is mainly sensitive to Cross-Talk.
- Set threshold of counter at 0.5, 1.5 and 2.5 photon electrons, compare the rates at different rates to extract Cross-Talk.
- Formalism to extract cross-talk is still needed to be derived, effect of pile up and after pulsing needed to be taken into account.
- ADC method (being tested, all done)
- Same method as pulse mode discussed in the PDE measurement
- Flash method
- Use Oscilloscope or Flash ADC to record the time spectrum with very weak but instantaneous light input (laser for example),
- By comparing the shape of the time spectrum from the single photon events with all events to extract the after pulsing
- Such a method was discussed in SiPM radiation test
Irradiation Test
- Irradiated with RadCon AmBe neutron souce
- 2011/04/15 09:30 - 2011/04/19 09:40
- Total dose: 43.3 rem
- Temperature: 25 degreeC
- Sample: #1 and #3
- 60C nealing
- 2011/04/25 18:00 - 2011/04/27 10:00
- Some results
- sample#1
- Before: 1.92 uA, 0.95 MHz
- Right after irradiation: 70 uA
- After irradiation and some recovery: 48.4 uA, 24.4 MHz
- After full recovery: 31.5 uA, 16.5 MHz
- Previous samples: 16 MHz/43.2 rem
- sample#1
- Conclusion
- Exactly the same radiation damage
Magnet field test
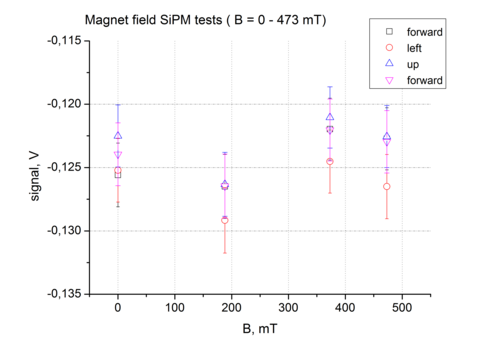
- Tested both the SiPM and its preamplifier in a magnetic field up to 0.5 Tesla, and no effect of the field was shown
Temperature Compensation Test
Instrumentation
- NI 6218
- 16-Bit, 250 kS/s Isolated M Series MIO DAQ
- Manual
- Fluke 189
- Data Logging Multimeter
- Manual
- LabVIEW Driver
- Tektronix TPO4104
- Mixed Signal Oscilloscope
- Manual
- LabVIEW Driver
