Difference between revisions of "CDC Hit Generation"
(→Gains/Losses with CDC cut applied) |
|||
| Line 17: | Line 17: | ||
'''''Example Run 72840 without(left) and with(right) cut at 180 for raw adc signal peak'''''<br> | '''''Example Run 72840 without(left) and with(right) cut at 180 for raw adc signal peak'''''<br> | ||
[[File:cdc_hits_run72840_noCDCcut.gif |300px]] [[File:cdc_hits_run72840_withCDCcutat180.gif |300px]] | [[File:cdc_hits_run72840_noCDCcut.gif |300px]] [[File:cdc_hits_run72840_withCDCcutat180.gif |300px]] | ||
| + | |||
| + | === Examples of the CDC drift times at various CDC signal amplitudesignal amplitudes === | ||
| + | The histogram (black) represent the CDC drift times while the red curve is a Gaussian fit to the peak while the blue curve is a phenomenological fit to whole drift time spectrum based on [https://halldweb.jlab.org/wiki/index.php/CDC_run_2016_drift_time_fits DRIFT TIME FITS]. | ||
| + | |||
| + | '''Drift time spectrum for the very lowest signal amplitude '''<br> | ||
| + | [[File:verylow_CDCamplitude1.png | 300px]]<br><br> | ||
| + | |||
| + | '''Drift time spectrum for the low signal amplitude '''<br> | ||
| + | [[File:cdc_verylowamp2.png| 300px]]<br><br> | ||
| + | |||
| + | '''Drift time spectrum for some lower signal amplitude '''<br> | ||
| + | [[File:cdc_lowamp1.png| 300px]]<br><br> | ||
| + | |||
| + | '''Drift time spectrum for some medium signal amplitude '''<br> | ||
| + | [[File:cdc_mediumamp.png| 300px]]<br><br> | ||
| + | |||
Revision as of 09:35, 13 May 2024
Contents
CDC Hits from CDCDigi Hits
- the code that converts raw hits from the fADC125s of the CDC into actual CDC Hits is done in several steps:
- the code DCDCHit_factory_Calib.cc takes the raw CDCDigiHits and create CDCHits based on the raw information. As can be seen in the 2d plots, the amplituded is a 9 bit word as the 3 least significant bits were dropped. In the hit factory the pedestal is subtracted from the signal peak amplitude and the integral (after correcting all raw data for truncation) and in addition the amplitude is converted into an energy based on calibration data. A code snipet of this procedure is shown here:
double amp = amp_a_scale*gain*double(maxamp); - In the following pictures the top row of 3 histograms shows the signal amplitude in ADC counts (raw 9bits) vs drift-time converted to ns (but not corrected for timing offsets) as reported by the FPGA of the fADC125. The left most graph shows the hits of channels in the same preamp card if the total number of the hits in that card surpasses 14 hits. The middle one is the same for preamp cards with hit multiplicity 10 to 14 while the right most shows hits from preamp cards with less than 10 hits in total. The raw data is taken from DCDCDigiHit objects generated from DCDCPulse objects. The 2d histogram in the bottom row on the left is the signal amplitude vs drift time again, however these data were taken from the DCDCHit objects where a scale factor and gain correction are applied to the signal amplitude. That moves the t0 peak close to a drift time of zero. The location of this t0 drift time depends on the signal amplitude and is reported in the graph in the middle of the bottom row. A Gaussian is fit to the distribution to determine the location of t0 as a function of signal amplitude. The error bars in the plot are the errors provided by the fit on the position.
- the code DCDCHit_factory_Calib.cc takes the raw CDCDigiHits and create CDCHits based on the raw information. As can be seen in the 2d plots, the amplituded is a 9 bit word as the 3 least significant bits were dropped. In the hit factory the pedestal is subtracted from the signal peak amplitude and the integral (after correcting all raw data for truncation) and in addition the amplitude is converted into an energy based on calibration data. A code snipet of this procedure is shown here:
Example Run 120594 without(left) and with(right) cut at 180 for raw adc signal peak
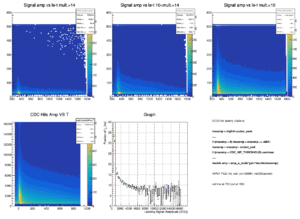
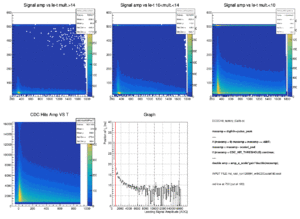
Example Run 72780 without(left) and with(right) cut at 180 for raw adc signal peak
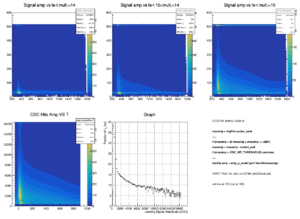
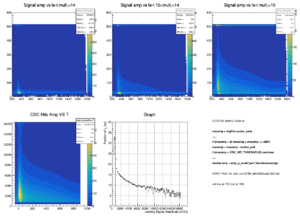
Example Run 72840 without(left) and with(right) cut at 180 for raw adc signal peak
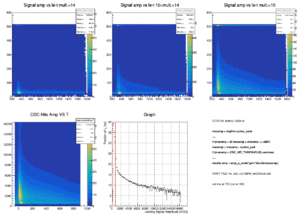
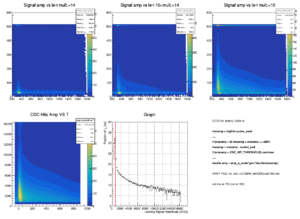
Examples of the CDC drift times at various CDC signal amplitudesignal amplitudes
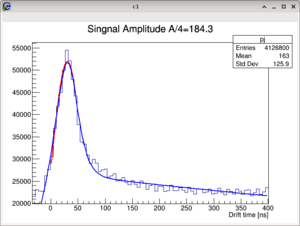
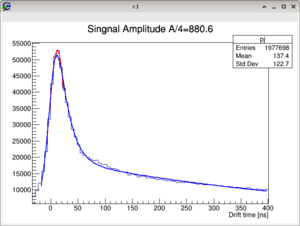
The histogram (black) represent the CDC drift times while the red curve is a Gaussian fit to the peak while the blue curve is a phenomenological fit to whole drift time spectrum based on DRIFT TIME FITS.
Drift time spectrum for the very lowest signal amplitude
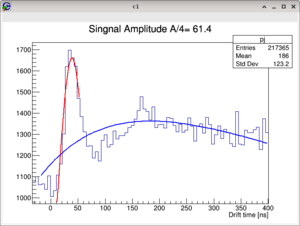
Drift time spectrum for the low signal amplitude
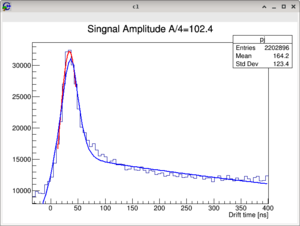
Drift time spectrum for some lower signal amplitude
Drift time spectrum for some medium signal amplitude
CDC Hit generation with amplitude cut
In the CDC hit factory a cut on the minimum amplitude after bit-shift correction is applied. This cut is 180 ADC counts:
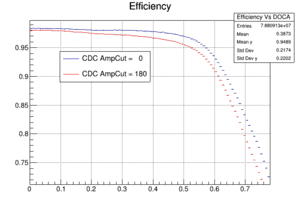
As expected the CDC Hit efficiency will drop and it drops more at larger drift distances. Below is a comparison of run 72840, first 10 files, without and with a cut of the CDC hit amplitude. At a drift distance of 7mm the drop is about 3.5% absolute.
Alexander A. analysis based on 20 files of run 30730 from 2017 run period finds:
- ver54 default /volatile/halld/home/aaustreg/RunPeriod-2017-01/monitoring/ver54/hists/merged/hd_root_030730.root
- 7.76 rho / 1k triggers
- 1.16 omega / 1k triggers
- ver55 CDC:CDC_HIT_THRESHOLD 180 /volatile/halld/home/aaustreg/RunPeriod-2017-01/monitoring/ver55/hists/merged/hd_root_030730.root
- 8.22 rho / 1k triggers (+6%)
- 1.22 omega / 1k triggers (+5%)
Looking at the number of tracks as a function of momentum and track angle shows some small differences when applying such a cut. This was done looking at data or run 72840. As an example below, a plot shows the small difference of the number of tracks with and without such an amplitude cut for both protons and pions for track hypotheses with best PID FOM and best tracking FOM a track angle between 80 and 85 degree: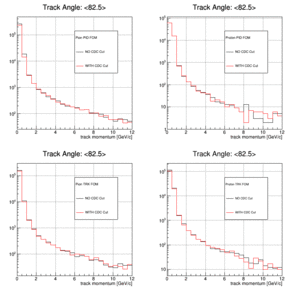
Gains/Losses with CDC cut applied
All runs that have been tested so far show a gain of several % when applying an amplitude cut on CDC hits. The runs of spring 2018 are subject to the gas leak in the CDC and may not provide a good test bed for this study. Also, all the beam intensity scans were done in this run period and may not be suitable for testing the impact of an amplitude cut on the CDC tracking performance.
| Run# | Ibeam | Rad | Target | #RhoWithCut | #RhoNoCut | #OmegaWithCut | #OmegaNoCut | Comment |
|---|---|---|---|---|---|---|---|---|
| 30730 | 100 | Diam | LH | 8.22 (+5.9%) | 7.76 | 1.22 (+5.1%) | 1.16 | ALL TAGH on |
| 30730 | 100 | Diam | LH | 8.22 (+5.9%) | 7.76 | 1.22 (+5.1%) | 1.16 | ALL TAGH on |
| 30796 | 150 | Diam | LH | 7.64 (+6.7%) | 7.16 | 0.90 (+7.1%) | 0.84 | VeryLow E TAGH off |
| 30816 | 150 | Diam | LH | 7.36 (+7.4%) | 6.85 | 0.90 (+8.4%) | 0.83 | VeryLow E TAGH off |
| 30888 | 220 | AMO3e-4 | LH | 4.57 (+6.7%) | 4.28 | 0.55 (+5.7%) | 0.52 | VeryLow E TAGH off |
| 30992 | 150 | AMO3e-4 | LH | 4.98 (+5.3%) | 4.73 | 0.62 (+5.1%) | 0.59 | VeryLow E TAGH off |
| 71377 | 150 | Diam | LH | 9.52 (+2.2%) | 9.31 | 1.25 (+1.6%) | 1.23 | VeryLow E TAGH off |
| 71465 | 250 | Diam | LH | 6.26 (+2.9%) | 6.08 | 0.85 (+3.6%) | 0.82 | VeryLow E TAGH off |
| 71615 | 350 | Diam | LH | 7.01 (+4.7%) | 6.69 | 0.88 (+6.0%) | 0.83 | ALLLow E TAGH off |
| 72840 | 350 | Diam | LH | 6.2 (+3.2%) | 6.01 | 0.78 (+2.6%) | 0.76 | ALLLow E TAGH off |
| 120688 | 300 | Diam | LH | 5.79 (+3.9%) | 5.57 | 0.71 (+2.9%) | 0.69 | ALLLow E TAGH off |