|
|
| Line 37: |
Line 37: |
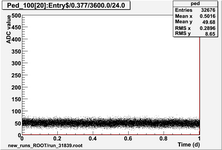
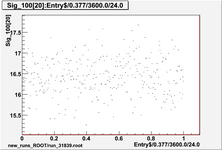
| | |[[Image:run_31839_pedsig.png|thumb|x150px|Pedestal std. dev. of samples 0-99, ch20, over 1 day ]] | | |[[Image:run_31839_pedsig.png|thumb|x150px|Pedestal std. dev. of samples 0-99, ch20, over 1 day ]] |
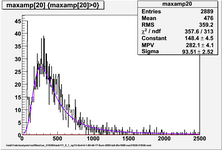
| | |[[Image:run_31839_amp20.png|thumb|x150px|Max amplitude ch20, hit threshold 4sigma ]] | | |[[Image:run_31839_amp20.png|thumb|x150px|Max amplitude ch20, hit threshold 4sigma ]] |
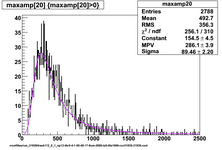
| | + | |[[Image:run_31839_thr5_amp20.png|thumb|x150px|Max amplitude ch20, hit threshold 5sigma ]] |
| | + | |[[Image:run_31839_thr5_amp20z.png|thumb|x150px|zoomed in, 5sigma, lines show 99% and 95% of landau summed 0-4000 ]] |
| | |} | | |} |
1950V, 60/40 gas, prototype horizontal
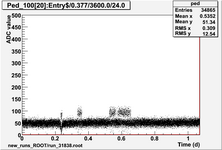 Pedestal mean of samples 0-99, ch20, over 1 day |
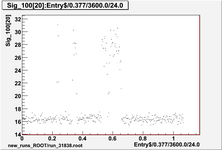 Pedestal std. dev. of samples 0-99, ch20, over 1 day |
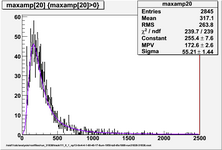 Max amplitude ch20, hit threshold 4sigma |
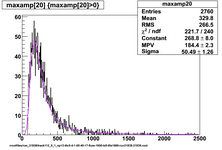 Max amplitude ch20, hit threshold 5sigma |
 zoomed in, 5sigma, lines show 99% and 95% of landau summed 0-4000 |
1975V, 60/40 gas, prototype horizontal
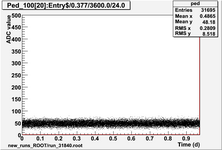 Pedestal mean of samples 0-99, ch20, over 1 day |
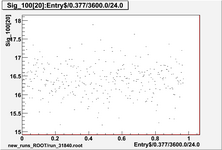 Pedestal std. dev. of samples 0-99, ch20, over 1 day |
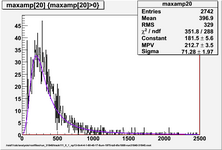 Max amplitude ch20, hit threshold 4sigma |
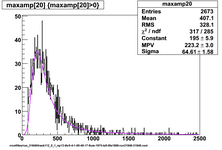 Max amplitude ch20, hit threshold 5sigma |
 zoomed in, 5sigma, lines show 99% and 95% of landau summed 0-4000 |
2000V, 60/40 gas, prototype horizontal
 Pedestal mean of samples 0-99, ch20, over 1 day |
 Pedestal std. dev. of samples 0-99, ch20, over 1 day |
 Max amplitude ch20, hit threshold 4sigma |
 Max amplitude ch20, hit threshold 5sigma |
 zoomed in, 5sigma, lines show 99% and 95% of landau summed 0-4000 |


