|
|
| Line 58: |
Line 58: |
| | {| border="0" cellpadding="2" | | {| border="0" cellpadding="2" |
| | |+ Resolution for 1975V, hit thresholds 5sigma, timing thresholds 4sigma, 1sigma, pedestal at t(t4sig)-13, tz_add=6, 60/40 Garfield | | |+ Resolution for 1975V, hit thresholds 5sigma, timing thresholds 4sigma, 1sigma, pedestal at t(t4sig)-13, tz_add=6, 60/40 Garfield |
| − | |[[Image:run_31842_res20_tz6_np13_6040.png|thumb|x250px|1975V, resolution ch 20]] | + | |[[Image:run_31842_res20_tz6_6040.png|thumb|x250px|1975V, resolution ch 20]] |
| − | |[[Image:run_31842_res20dx_tz6_np13_6040.png|thumb|x250px|1975V, resolution vs hit radius]] | + | |[[Image:run_31842_resx20_tz6_6040.png|thumb|x250px|1975V, resolution vs hit radius]] |
| | |} | | |} |
| | | | |
| | This does not look nearly as good as 50/50 gas mix. Suspect total flow of 60sccm might be too low for the CO2 MFC. Increase to 80sccm and repeat. Also try Garfield for different gas mixes and look at tmax. | | This does not look nearly as good as 50/50 gas mix. Suspect total flow of 60sccm might be too low for the CO2 MFC. Increase to 80sccm and repeat. Also try Garfield for different gas mixes and look at tmax. |
Revision as of 11:50, 11 September 2012
60/40 Ar/CO2 and cosmics, prototype horizontal
1800V, 60/40 gas, prototype horizontal
 Pedestal mean of samples 0-99, ch20, over 1 day |
 Pedestal std. dev. of samples 0-99, ch20, over 1 day |
 Max amplitude ch20, hit threshold 4sigma |
1900V, 60/40 gas, prototype horizontal
 Pedestal mean of samples 0-99, ch20, over 1 day |
 Pedestal std. dev. of samples 0-99, ch20, over 1 day |
 Max amplitude ch20, hit threshold 4sigma |
1950V, 60/40 gas, prototype horizontal
 Pedestal mean of samples 0-99, ch20, over 1 day |
 Pedestal std. dev. of samples 0-99, ch20, over 1 day |
 Max amplitude ch20, hit threshold 4sigma |
 Max amplitude ch20, hit threshold 5sigma |
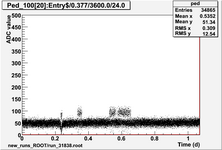
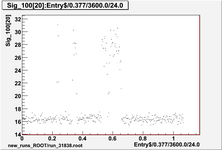
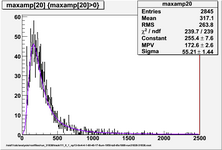
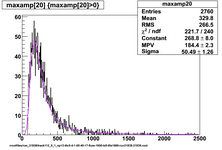
1975V, 60/40 gas, prototype horizontal
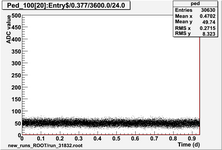
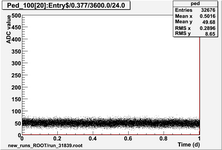
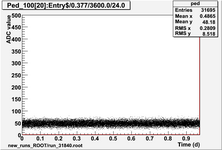 Pedestal mean of samples 0-99, ch20, over 1 day |
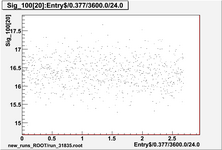
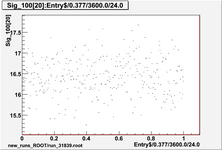
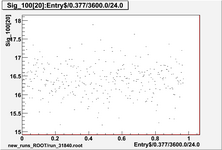 Pedestal std. dev. of samples 0-99, ch20, over 1 day |
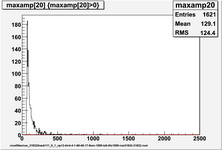
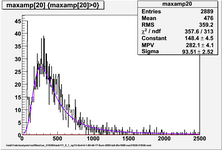
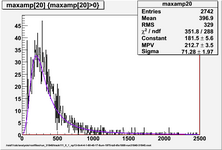 Max amplitude ch20, hit threshold 4sigma |
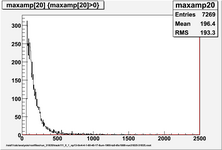
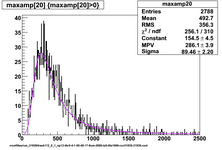
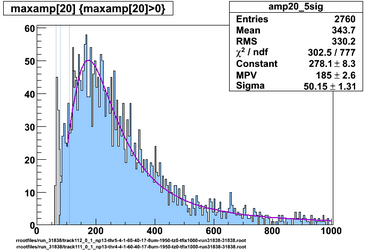
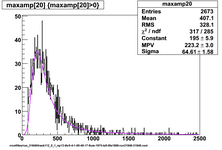 Max amplitude ch20, hit threshold 5sigma |
2000V, 60/40 gas, prototype horizontal
 Pedestal mean of samples 0-99, ch20, over 1 day |
 Pedestal std. dev. of samples 0-99, ch20, over 1 day |
 Max amplitude ch20, hit threshold 4sigma |
 Max amplitude ch20, hit threshold 5sigma |
60/40 gas, prototype horizontal, 4sigma (gray) and 5sigma (blue) hit threshold, fit range 6sigma+
 1950V, lines show 99.7%, 99% and 95% of landau summed 0-4000 (64, 79, 110) |
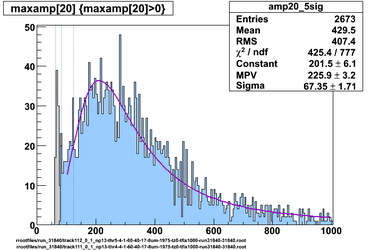 1975V, lines show 99.7%, 99% and 95% of landau summed 0-4000 (63, 84, 124) |
 2000V, lines show 99.7%, 99% and 95% of landau summed 0-4000 (75, 101, 154) |
Drift time for 1975V, hit thresholds 5sigma, timing thresholds 4sigma, 1sigma, pedestal at t(t4sig)-13, tz_add=0
|
|
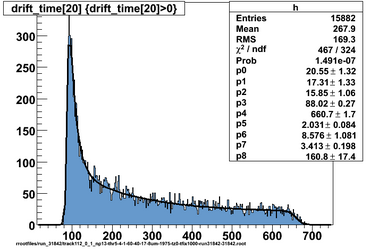 1975V, hit threshold 5sigma, time thresholds 4 and 1 sigma Estimate of t0 is 88 and tmax is 661, difference is 573, straight-line intercept is 81.7, to match histogram fit t0, use tz_add 6.4 |
Resolution for 1975V, hit thresholds 5sigma, timing thresholds 4sigma, 1sigma, pedestal at t(t4sig)-13, tz_add=6, 60/40 Garfield
|
|
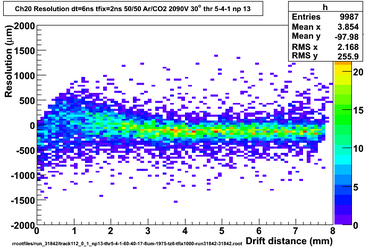 1975V, resolution vs hit radius |
This does not look nearly as good as 50/50 gas mix. Suspect total flow of 60sccm might be too low for the CO2 MFC. Increase to 80sccm and repeat. Also try Garfield for different gas mixes and look at tmax.


