Difference between revisions of "Fiber Test Stand at JLAB"
(→Sr90 collimation) |
|||
| Line 15: | Line 15: | ||
=== Sr90 collimation === | === Sr90 collimation === | ||
| − | The Sr90 source is collimated by a piece of copper shown in the above picture. A schematic view is shown below. The scintillation fiber lies in a 1mm x 1mm groove of the copper collimator thereby being fixed in | + | The Sr90 source is collimated by a piece of copper shown in the above picture. A schematic view is shown below. The scintillation fiber lies in a 1mm x 1mm groove of the copper collimator thereby being fixed in position. At the center of the copper piece a 0.5mm wide and 5mm long slit provides the collimation. The slit is in the center and parallel to the groove where the fiber is located.<br> [[Image:sr90_collimation.gif|160px]] |
== XP2020 PMT responses to blue LED == | == XP2020 PMT responses to blue LED == | ||
Revision as of 10:44, 28 August 2008
Contents
References
- E.H. Ballamy et al, Nucl. Inst. and Meth. A 339 (1994)468-476
Fiber Test Stand
The purpose of the fiber test stand at JLAB is to determine the number of photo electrons produced by a minimum ionizing particle in a scintillating fiber at a distance of 200cm from the fiber end. The photon detector is a standard photo multiplier, in this case an XP2020. In addition the attenuation length of the scintillator can be determined measuring the light output at several positions along the fiber.
Concept
One end of the scintillation fiber is coupled to the photo cathode of a PMT (XP2020). For monitoring purposes a second fiber (light guide) is also coupled to the same PMT providing light from a blue LED. At a given distance from the PMT surface a collimated Strontium (Sr90) source is mounted above the scintillation fiber. Below the fiber and the Sr90 source a small trigger scintillation detector (TSD) is mounted to trigger on electrons from the Sr90 source. The data acquisition is triggered by TSD and the analog signals from both the XP2020 and the TSD are digitized as well as their timing. Simultaneously a trigger is generated for the LED light source to monitor the XP2020 PMT during the measurement.
Electronic layout
A basic sketch of the NIM electronics layout is shown here.
The signal from the XP2020 PMT is first amplified by a factor of 10 and then connected to a linear FAN In/Out. The DC offset of the linear FAN In/Out is adjusted such that the true pedestal is above the built in pedestal of the V972N VME ADC, which is about 5pC total charge. This corresponds to about 15mV of negative DC offset for the used gate width. The analog signal is then connected to the ADC adjusted for timing. A second output of the linear FAN In/Out is connected to a discriminator the output of which is then connected to F1TDC. The trigger scintillator is also connected to a linear FAN In/Out. Also here the DC offset is adjusted to move the true pedestal of the signal above threshold in the ADC. The analog signal is also discriminated and one output connected to the trigger OR which is linked to the trigger interface TI in VME of the DAQ system. The second trigger of the system is the trigger for the blue LED for monitoring purposes. The rate of this can be adjusted using two Gate/Delay generators and is set to about 10 Hz during measurements. The trigger rate from the TSD caused by the electrons of the Sr90 source is also in the order of 10 Hz.
Dark Box
The detectors, scintillators and Sr90 source are currently located in an improvised dark box to protect the system for ambient light. Picture of the setup can be seen here as well and the fiber coupling to the PMT and the Sr90 source collimation:


Sr90 collimation
The Sr90 source is collimated by a piece of copper shown in the above picture. A schematic view is shown below. The scintillation fiber lies in a 1mm x 1mm groove of the copper collimator thereby being fixed in position. At the center of the copper piece a 0.5mm wide and 5mm long slit provides the collimation. The slit is in the center and parallel to the groove where the fiber is located.

XP2020 PMT responses to blue LED
The response of the XP2020 on the LED light is shown for two different LED intensities (Low Voltage settings) in the form of the ADC spectra. The voltage divider used here for the XP2020 is a VD124K/T from Photonic (Type C divider). The fit is a Poisson distribution weighted sum of Gaussian distributions that are convoluted with the pedestal width and an exponential background.


The HV of the XP2020 PMT is set at -2200V. The corresponding single photo electron peak position (fit parameter P1) is about 41 ADC channels corresponding to a gain of the PMT of 2.6*10^6. The fit parameter mu is the mean number of photo electrons from the Poisson distribution.
Trigger Scintillator response
The ADC spectrum of the trigger scintillator using a H3165-10 PMT and a 10cm long, 10cm thick and 8mm wide scintillator bar is shown here

The Fit Function
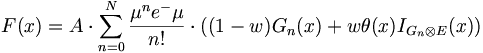
where  is the number of events,
  is the nth Gaussian convoluted with the pedestal-Gaussian and
  is the nth Gaussian convoluted with and exponential background with
  the probability of such an exponential background event occuring. The function
  is a step function being 0 for
  and 1 for
  .
.
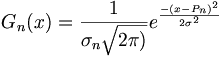 with
with 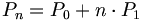 the ADC position of the nth Gaussian with width
 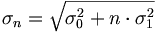 . The index 0 refers to the pedestal and n=1,2,... is the number of photo-electrons.
![I_{{G_{n}\otimes E}}(x)={\frac {\alpha }{2}}e^{{-\alpha (x-P_{n}-\alpha \sigma _{n}^{2})}}\left[erf({\frac {|P_{0}-P_{n}-\alpha \sigma _{n}^{2}|}{\sigma _{n}{\sqrt {2}}}})+sign(x-P_{n}-\alpha \sigma _{n}^{2})\cdot erf({\frac {|x-P_{n}-\alpha \sigma _{n}^{2}|}{\sigma _{n}{\sqrt {2}}}})\right]](/wiki/images/math/0/7/5/07556a9d24c3a1da2b3e54462b17e5bb.png) is the convolution of the nth Gaussian with the exponential background leading to a tail for each Gaussian on the right side of the peak.
is the convolution of the nth Gaussian with the exponential background leading to a tail for each Gaussian on the right side of the peak.
The Fit parameters are:
-
 : pedestal position
 -
 : pedestal width (FIXED from fit to pedestal only)
 -
 : single photo electron peak position
 -
 : single photo electron peak width
 -
 : exponential background
 - : probability of exponential background
-
 : MEAN NUMBER OF PHOTO ELECTRONS
Fiber types
The following fibers have been tested:
- Kuraray (MC=Multi-Clad)
- Blue 81 MC lot:0801/103
Results:
The following plots show the PMT response to the Sr90 source positioned at 65cm, 165cm and 194cm from the photo cathode. In the pannels the value labled "mu" is the mean number of photo electrons detected by the PMT.
- Blue 78 MC lot:0801/104
Results:
Similar the following plots show the PMT response to the Sr90 source positioned at 61cm, 94cm and 194cm from the photo cathode. Again as above the value labled "mu" in the pannel is the mean number of photo electrons detected by the PMT.
- Green 3HF MC lot:0801/105
Results:
As above, plots for the green fiber the Sr90 source positioned at 65cm, 165cm.
- Blue 81 MC lot:0801/103


