|
|
| Line 93: |
Line 93: |
| | | | |
| | {| border="0" cellpadding="2" | | {| border="0" cellpadding="2" |
| − | |+ Resolution for 1975V, hit thresholds 5sigma, timing thresholds 4sigma, 1sigma, pedestal at t(t4sig)-13, tz_add=6, 60/40 Garfield | + | |+ Resolution for 1975V, same thresholds and pedestal as before, tz_add=6ns, 59/41 Garfield |
| | |[[Image:run_31842_res20_tz6_5941.png|thumb|x250px|1975V, resolution ch 20]] | | |[[Image:run_31842_res20_tz6_5941.png|thumb|x250px|1975V, resolution ch 20]] |
| | |[[Image:run_31842_resx20_tz6_5941.png|thumb|x250px|1975V, resolution vs hit radius]] | | |[[Image:run_31842_resx20_tz6_5941.png|thumb|x250px|1975V, resolution vs hit radius]] |
| | |} | | |} |
Revision as of 16:24, 12 September 2012
60/40 Ar/CO2 and cosmics, prototype horizontal
1800V, 60/40 gas, prototype horizontal
 Pedestal mean of samples 0-99, ch20, over 1 day |
 Pedestal std. dev. of samples 0-99, ch20, over 1 day |
 Max amplitude ch20, hit threshold 4sigma |
1900V, 60/40 gas, prototype horizontal
 Pedestal mean of samples 0-99, ch20, over 1 day |
 Pedestal std. dev. of samples 0-99, ch20, over 1 day |
 Max amplitude ch20, hit threshold 4sigma |
1950V, 60/40 gas, prototype horizontal
 Pedestal mean of samples 0-99, ch20, over 1 day |
 Pedestal std. dev. of samples 0-99, ch20, over 1 day |
 Max amplitude ch20, hit threshold 4sigma |
 Max amplitude ch20, hit threshold 5sigma |
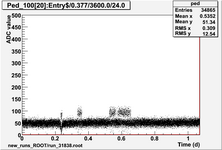
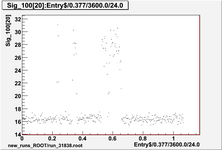
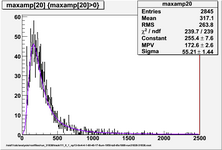
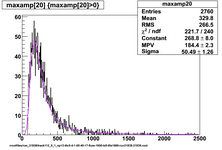
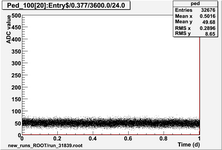
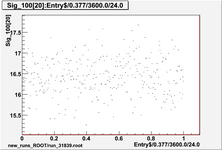
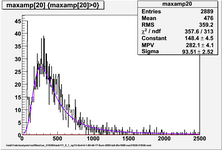
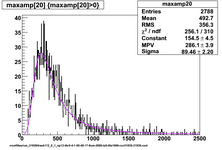
1975V, 60/40 gas, prototype horizontal
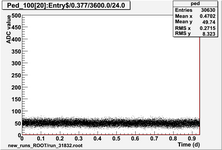
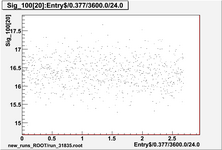
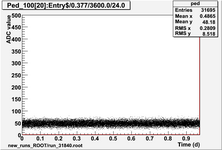 Pedestal mean of samples 0-99, ch20, over 1 day |
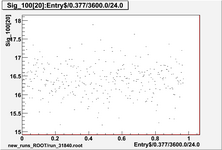 Pedestal std. dev. of samples 0-99, ch20, over 1 day |
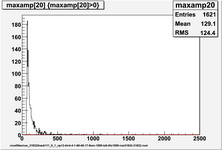
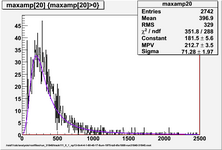 Max amplitude ch20, hit threshold 4sigma |
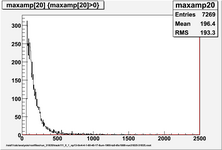
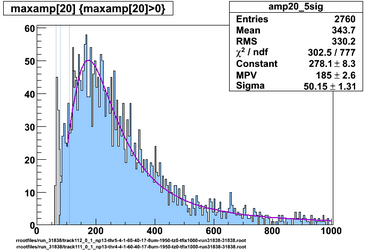
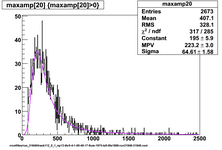 Max amplitude ch20, hit threshold 5sigma |
2000V, 60/40 gas, prototype horizontal
 Pedestal mean of samples 0-99, ch20, over 1 day |
 Pedestal std. dev. of samples 0-99, ch20, over 1 day |
 Max amplitude ch20, hit threshold 4sigma |
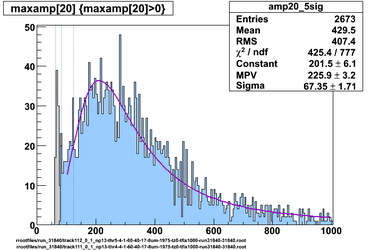
 Max amplitude ch20, hit threshold 5sigma |
60/40 gas, prototype horizontal, 4sigma (gray) and 5sigma (blue) hit threshold, fit range 6sigma+
 1950V, lines show 99.7%, 99% and 95% of landau summed 0-4000 (64, 79, 110) |
 1975V, lines show 99.7%, 99% and 95% of landau summed 0-4000 (63, 84, 124) |
 2000V, lines show 99.7%, 99% and 95% of landau summed 0-4000 (75, 101, 154) |
Drift time for 1975V, hit thresholds 5sigma, timing thresholds 4sigma, 1sigma, pedestal at t(t4sig)-13, tz_add=0
|
|
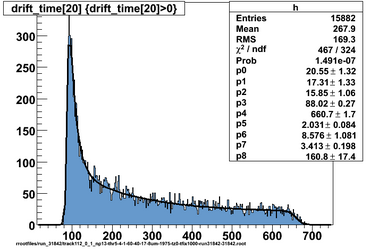 1975V, hit threshold 5sigma, time thresholds 4 and 1 sigma Estimate of t0 is 88 and tmax is 661, difference is 573, straight-line intercept is 81.7, to match histogram fit t0, use tz_add 6.4 |
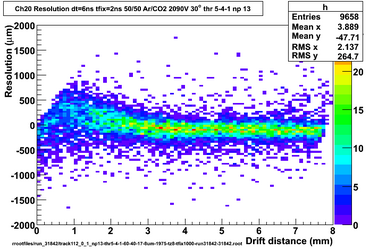
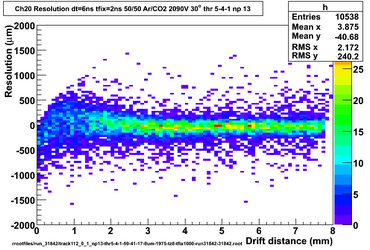
Resolution for 1975V, hit thresholds 5sigma, timing thresholds 4sigma, 1sigma, pedestal at t(t4sig)-13, tz_add=6, 60/40 Garfield
|
|
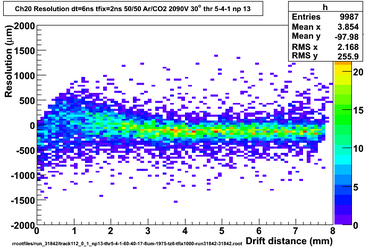 1975V, resolution vs hit radius |
This does not look nearly as good as 50/50 gas mix.
Resolution is calculated as fitted drift distance - measured (interpolated) distance, so it is positive when the measured drift time and distance are too small.
In this case they are slightly too small at small drift distance but too large at large drift distance. This could be a problem with the gas mix. For reference, plot res vs distance for tz=5,7,and 0.
Resolution for 1975V, hit thresholds 5sigma, timing thresholds 4sigma, 1sigma, pedestal at t(t4sig)-13, tz_add=8, 60/40 Garfield
|
|
 1975V, resolution vs hit radius |
Increasing tz_add to 8ns shifts the resolution up at earlier times but it hardly moves at later times. This would probably have been obvious from the tz=0 data (below) where all the measured drift distances are too large. "Measured" drift distances are actually interpolated from a table of distance calculated for a given gas mix and a range of time measurements. So for this data I should use Garfield tables for a gas mix with slower drift velocity, ie less Ar.
Resolution for 1975V, hit thresholds 5sigma, timing thresholds 4sigma, 1sigma, pedestal at t(t4sig)-13, tz_add=0, 60/40 Garfield
|
|
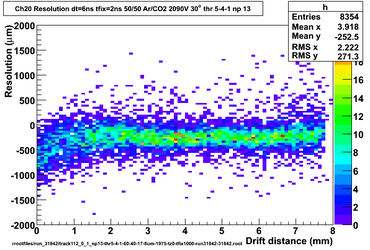 1975V, resolution vs hit radius |
Suspect total flow of 60sccm might be too low for the CO2 MFC. Increase to 80sccm and repeat. Also try Garfield for different gas mixes and look at tmax.
Fitted Tmax was 573, edge is from 560 to 600ns. Garfield calcs give 560ns for 60/40, 573ns for 59/41, 588ns for 28/42 and 610ns for 57/43.
It's easiest to look at resolution far from the wire to find the best gas mix model.
Resolution for 1975V, drift time > 240ns (~approx 5mm), different gas mix in Garfield, same thresholds and pedestal as before, tz_add=6ns
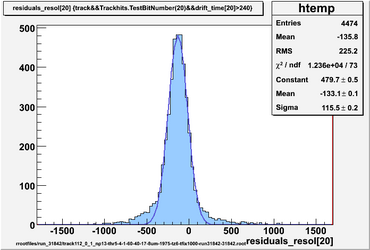 1975V, resolution for tracks with drift time in this straw > 240ns |
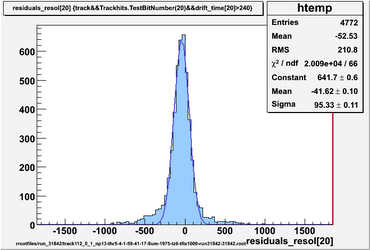 1975V, resolution for tracks with drift time in this straw > 240ns |
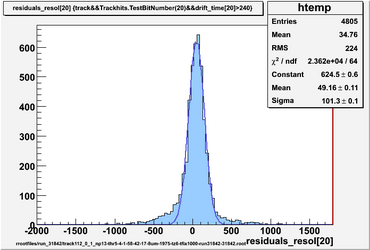 1975V, resolution for tracks with drift time in this straw > 240ns |
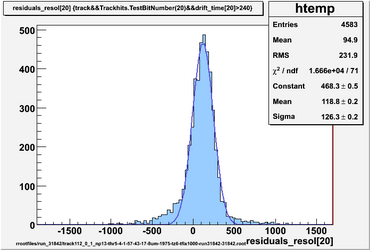 1975V, resolution for tracks with drift time in this straw > 240ns |
Resolution for 1975V, same thresholds and pedestal as before, tz_add=6ns, 59/41 Garfield
|
|
 1975V, resolution vs hit radius |


