Difference between revisions of "Event Analyzer"
From GlueXWiki
| Line 4: | Line 4: | ||
FADC readout: RAW window mode (100 samples) | FADC readout: RAW window mode (100 samples) | ||
| + | |||
| + | Histograms: | ||
| + | |||
| + | 1. FADC pulses: 16 channels downstream side, 16 channels upstream side | ||
| + | X axis - samples, Y - fadc amplitudes | ||
| + | |||
| + | 2. TDC hits (time): 12 channels (downstream) + 12 channels (upstream) | ||
<gallery> | <gallery> | ||
| − | File:bcal_cos_fadc1.png | FADC1 downstream side | + | File:bcal_cos_fadc1.png | FADC1 downstream side |
File:bcal_cos_fadc2.png | FADC2 upstream side | File:bcal_cos_fadc2.png | FADC2 upstream side | ||
| − | File:bcal_cos_tdc1.png | TDC hits downstream | + | File:bcal_cos_tdc1.png | TDC hits downstream |
File:bcal_cos_tdc2.png | TDC hits upstream | File:bcal_cos_tdc2.png | TDC hits upstream | ||
</gallery> | </gallery> | ||
Revision as of 01:46, 31 March 2012
- Some plots from the event analyzer. A 'typical' example of a cosmics event (triggered with a small scintillator).
Cosmics particles come from the left. 4+4=8 hits in 2 FADCs and 4+4=8 hits in the TDC
FADC readout: RAW window mode (100 samples)
Histograms:
1. FADC pulses: 16 channels downstream side, 16 channels upstream side
X axis - samples, Y - fadc amplitudes
2. TDC hits (time): 12 channels (downstream) + 12 channels (upstream)
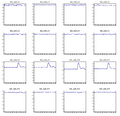
FADC1 downstream side
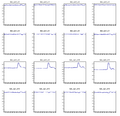
FADC2 upstream side
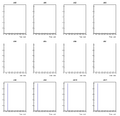
TDC hits downstream
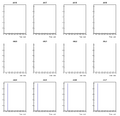
TDC hits upstream


