Difference between revisions of "CDC 60 40"

From GlueXWiki
Jump to: navigation, search
Line 48: Line 48:
 
|+ 60/40 gas, prototype horizontal, 4sigma (gray) and 5sigma (blue) hit threshold, fit range 6sigma+
 
|+ 60/40 gas, prototype horizontal, 4sigma (gray) and 5sigma (blue) hit threshold, fit range 6sigma+
 
|[[ |thumb|x250px|]]
 
|[[ |thumb|x250px|]]
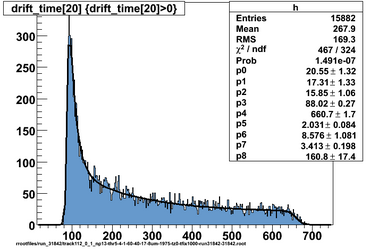
|[[Image:run_31842_dt20.png|thumb|x250px|1975V, hit threshold 5sigma, time thresholds 4 and 1 sigma]]
+
|[[Image:run_31842_dt20.png|thumb|x250px|1975V, hit threshold 5sigma, time thresholds 4 and 1 sigma
 +
Estimate of t0 is 88 and tmax is 661, difference is 573, straight-line intercept is 81.7, to match histogram fit t0, use tz_add 6.4
 +
]]
 
|[[ |thumb|x250px|]]
 
|[[ |thumb|x250px|]]
 
|}
 
|}

Revision as of 12:22, 7 September 2012

1800V, 60/40 gas, prototype horizontal
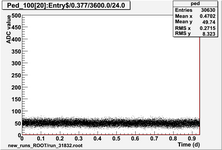
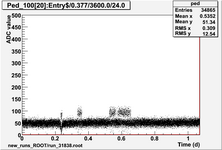
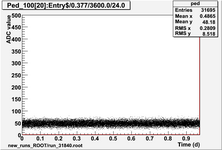
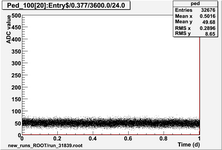
Pedestal mean of samples 0-99, ch20, over 1 day
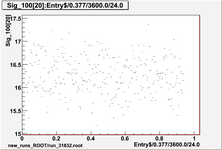
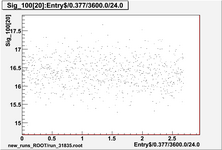
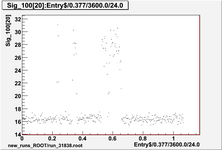
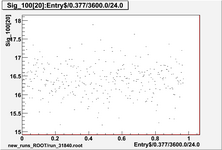
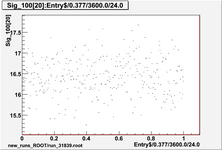
Pedestal std. dev. of samples 0-99, ch20, over 1 day
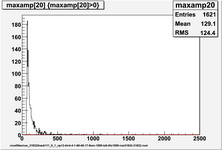
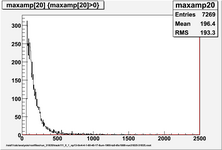
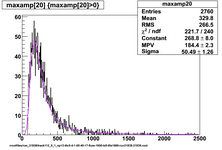
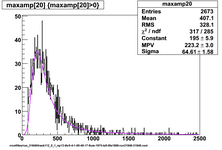
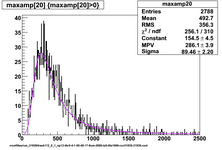
Max amplitude ch20, hit threshold 4sigma
1900V, 60/40 gas, prototype horizontal
Pedestal mean of samples 0-99, ch20, over 1 day
Pedestal std. dev. of samples 0-99, ch20, over 1 day
Max amplitude ch20, hit threshold 4sigma
1950V, 60/40 gas, prototype horizontal
Pedestal mean of samples 0-99, ch20, over 1 day
Pedestal std. dev. of samples 0-99, ch20, over 1 day
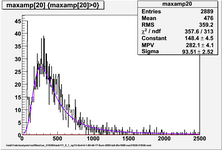
Max amplitude ch20, hit threshold 4sigma
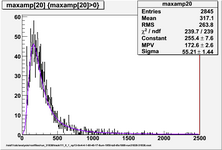
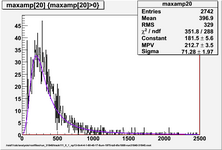
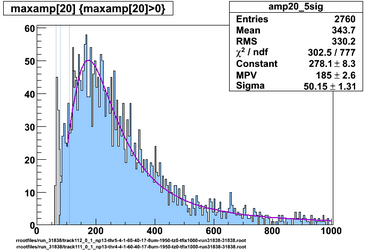
Max amplitude ch20, hit threshold 5sigma
1975V, 60/40 gas, prototype horizontal
Pedestal mean of samples 0-99, ch20, over 1 day
Pedestal std. dev. of samples 0-99, ch20, over 1 day
Max amplitude ch20, hit threshold 4sigma
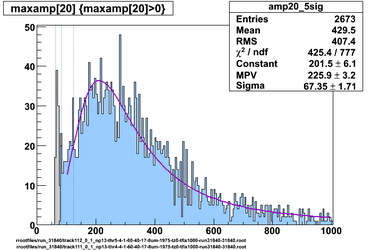
Max amplitude ch20, hit threshold 5sigma
2000V, 60/40 gas, prototype horizontal
Pedestal mean of samples 0-99, ch20, over 1 day
Pedestal std. dev. of samples 0-99, ch20, over 1 day
Max amplitude ch20, hit threshold 4sigma
Max amplitude ch20, hit threshold 5sigma


60/40 gas, prototype horizontal, 4sigma (gray) and 5sigma (blue) hit threshold, fit range 6sigma+
1950V, lines show 99.7%, 99% and 95% of landau summed 0-4000 (64, 79, 110)
1975V, lines show 99.7%, 99% and 95% of landau summed 0-4000 (63, 84, 124)
2000V, lines show 99.7%, 99% and 95% of landau summed 0-4000 (75, 101, 154)
60/40 gas, prototype horizontal, 4sigma (gray) and 5sigma (blue) hit threshold, fit range 6sigma+
[[ |thumb|x250px|]]
1975V, hit threshold 5sigma, time thresholds 4 and 1 sigma Estimate of t0 is 88 and tmax is 661, difference is 573, straight-line intercept is 81.7, to match histogram fit t0, use tz_add 6.4
[[ |thumb|x250px|]]