Difference between revisions of "CDC algo status"
From GlueXWiki
| Line 34: | Line 34: | ||
{| border="0" cellpadding="2" | {| border="0" cellpadding="2" | ||
|+ Combined simplifications (20 samples upsampled) | |+ Combined simplifications (20 samples upsampled) | ||
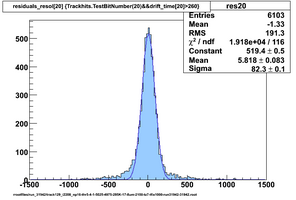
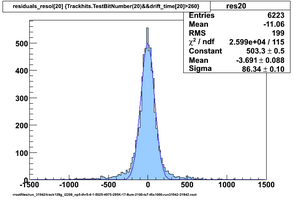
| − | |[[Image:cdc_run_31942_track129f_np5_thr_5_4_1.png|thumb|x200px|Event ped is mean of 4 samples, local ped is mean of 4 and 5 samples before hit_thr]] | + | |[[Image:cdc_run_31942_track129f_np5_thr_5_4_1.png|thumb|x200px|(a) Event ped is mean of 4 samples, local ped is mean of 4 and 5 samples before hit_thr]] |
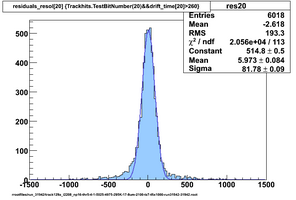
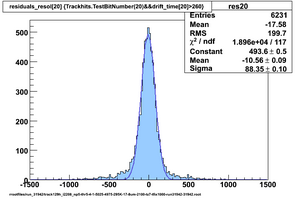
| − | |[[Image:cdc_run_31942_track129g_np5_thr_5_4_1.png|thumb|x200px|As left, but no interpolation when finding high and low thresholds]] | + | |[[Image:cdc_run_31942_track129g_np5_thr_5_4_1.png|thumb|x200px|(b) As left, but no interpolation when finding high and low thresholds]] |
|- | |- | ||
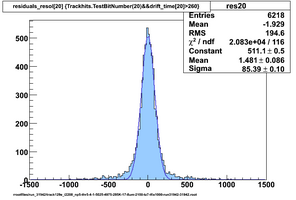
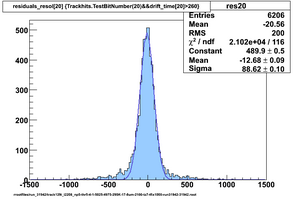
| − | + | [[Image:cdc_run_31942_track129h_np5_thr_5_1.png|thumb|x200px|(c) As top left, hit time is interpolated low threshold crossing time]] | |
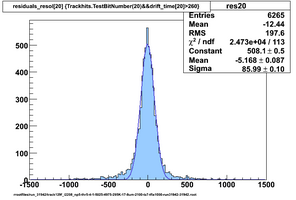
| − | [[Image:cdc_run_31942_track129h_np5_thr_5_1.png|thumb|x200px|As top left, hit time is interpolated low threshold crossing time]] | + | [[Image:cdc_run_31942_track129i_np5_thr_5_1.png|thumb|x200px|(d) As top left, hit time is low threshold crossing time without interpolation]] |
| − | + | ||
| − | [[Image:cdc_run_31942_track129i_np5_thr_5_1.png|thumb|x200px|As top left, hit time is low threshold crossing time without interpolation]] | + | |
|} | |} | ||
| − | + | Lower line (c and d) are from single threshold crossings | |
Revision as of 17:32, 10 January 2014
Add simplifications to offline code to show impact
Using prototype data from CDC_50_50 (run 31942) with offline analysis
50/50 Ar/CO2 and cosmics, 2100V, prototype horizontal
Only 20 samples upsampled
- Event pedestal is mean of 100 samples ending at trigger time
- Find hit threshold crossing
- Upsample 20 samples starting 10 before hit threshold crossing
- Find hit threshold crossing again in upsampled data
- Step back <pedlead> points to find new local pedestal
- Search forward to find high threshold crossing
- Search backward to find low threshold crossing
- Project through both thresholds to find pedestal crossing time
Selected results below
Lower line (c and d) are from single threshold crossings
