Difference between revisions of "Construction of Low-Granularity counters"
(→Cosmic Ray Detecting) |
|||
| Line 158: | Line 158: | ||
Nate, edit this however you'd like. I just thought I would upload some files. | Nate, edit this however you'd like. I just thought I would upload some files. | ||
| − | + | ==Assembly== | |
==Installation== | ==Installation== | ||
Revision as of 14:27, 8 July 2013
Contents
PMT Testing
Expectations
The photomultiplier tubes (i.e. 18 in all) should, in principle, all exhibit the same characteristics. All 18 should have the same change in output amplitude with a change in input potential, as well as identical time responses regardless of the input potential. Therefore, one would expect a histogram of these characteristics to show a count of 18 at a single value on the x-axis. Consequently, a logarithmic plot of the overall gains of each PMT should be 18 identical lines of positive slope.
The Hamamatsu Photomultiplier Tube (H7415) was chosen because it has the characteristics required for this pair spectrometer. This PMT will be attached to the EJ-200 organic plastic scintillator and light guide fabricated by Eljen Technology. The properties of the tube are in the table below:
| Photomultiplier Tube Assembly (H7415) | |
| Dynode Structure | Linear-focused |
| Dynode Stages | 10 |
| Max. Rating) Anode to Cathode Voltage | -2000 V |
| Anode to Cathode Supply Voltage | -1500 V |
| Anode) Gain Typ. | 5E+06 |
| (Time Response) Rise Time Typ. | 1.7 ns |
| (Time Response) Transit Time Typ. | 16 ns |
Rise time listed here was arrived at using a laser. In the testing of the PMT's at Jefferson Lab, an LED will be used, which will not produce a clean signal elimination like the laser.
Testing
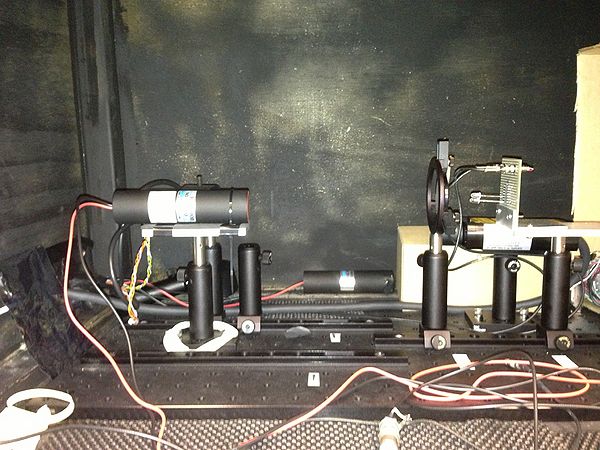
To test the PMT's, connections had to be soldered on to the wires in order to have quick connection ability to both the oscilloscope and high-voltage power source. Once this was done, the PMT was placed in a previously fabricated dark box with mounts for the tube and LED. The LED was powered by a wave generator which was set to run 8V square waves at 10 kHz with a 8 ns pulse width. Figure 1 shows the set up used for each PMT.
The LED was positioned behind a diffracted lens to spread the light out. Careful attention had to be made that each PMT was positioned at the same place on the mount in order to eliminate fluctuations in beam intensity. The anode-to-cathode potential would range from -1.1 kV to -1.5 kV.
Data
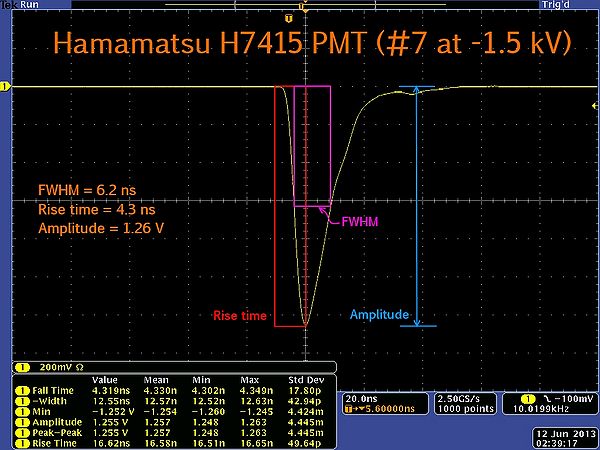
The data gathered from the oscilloscope were the amplitude and rise time. Figure 2 shows what those values represent on the oscilloscope screen. Amplitudes were measured in millivolts and the rise time was in nanoseconds.
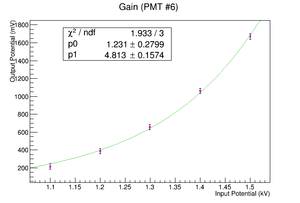
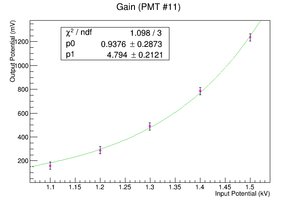
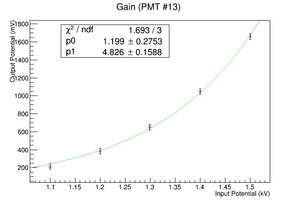
The data for the PMT amplitudes is in the table below. At -1.1 kV, the minimum amplitude was 124 mV. At -1.5 kV, the maximum amplitude was 1660 mV.
| PMT Amplitudes (mV) | ||||||
|---|---|---|---|---|---|---|
| PMT # | -1.1 kV | -1.2 kV | -1.3 kV | -1.4 kV | -1.5 kV | |
| 1 | 171 | 303 | 513 | 833 | 1320 | |
| 2 | 124 | 219 | 365 | 583 | 906 | |
| 3 | 187 | 330 | 553 | 892 | 1400 | |
| 4 | 213 | 376 | 627 | 1010 | 1575 | |
| 5 | 216 | 387 | 657 | 1060 | 1670 | |
| 6 | 178 | 313 | 522 | 839 | 1310 | |
| 7 | 171 | 302 | 507 | 812 | 1256 | |
| 8 | 181 | 322 | 542 | 877 | 1380 | |
| 9 | 159 | 284 | 473 | 755 | 1160 | |
| 10 | 168 | 299 | 504 | 811 | 1260 | |
| 11 | 160 | 289 | 489 | 785 | 1236 | |
| 12 | 210 | 370 | 624 | 1000 | 1556 | |
| 13 | 214 | 385 | 650 | 1050 | 1660 | |
| 14 | 203 | 359 | 600 | 968 | 1500 | |
| 15 | 159 | 287 | 483 | 780 | 1215 | |
| 16 | 170 | 299 | 504 | 810 | 1300 | |
| 17 | 195 | 348 | 607 | 970 | 1500 | |
| 18 | 216 | 376 | 627 | 997 | 1550 | |
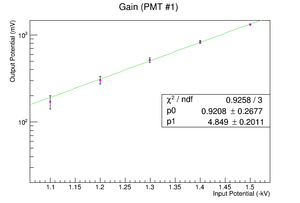
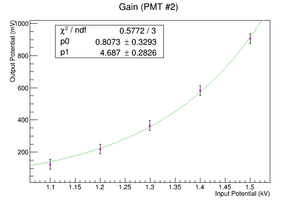
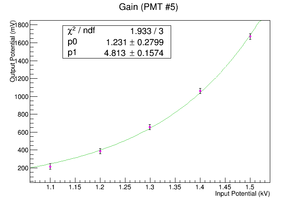
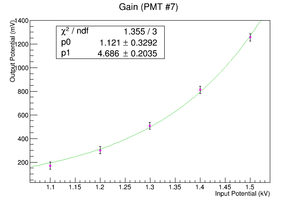
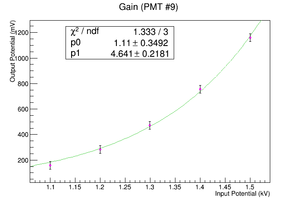
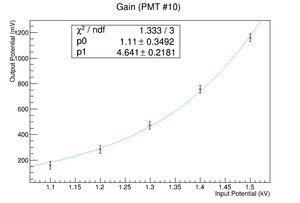
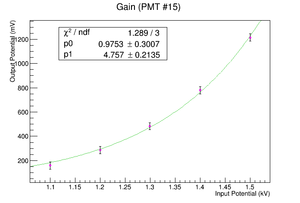
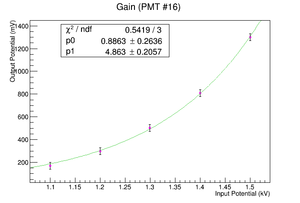
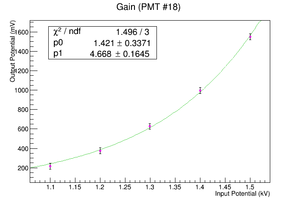
The data in the table above produced the plots located at the right side of the page.
| PMT # | Slope of gain |
|---|---|
| 1 | 0.00287 |
| 2 | 0.00196 |
| 3 | 0.00303 |
| 4 | 0.00341 |
| 5 | 0.00364 |
| 6 | 0.00283 |
| 7 | 0.00271 |
| 8 | 0.00300 |
| 9 | 0.00250 |
| 10 | 0.00273 |
| 11 | 0.00269 |
| 12 | 0.00337 |
| 13 | 0.00362 |
| 14 | 0.00324 |
| 15 | 0.00264 |
| 16 | 0.00283 |
| 17 | 0.00326 |
| 18 | 0.00334 |
| Rise Time (ns) | |||
|---|---|---|---|
| PMT # | -1.1 kV | -1.5 kV | |
| 1 | 4.57 | 4.33 | |
| 2 | 4.76 | 4.33 | |
| 3 | 4.58 | 4.28 | |
| 4 | 4.66 | 4.33 | |
| 5 | 4.61 | 4.31 | |
| 6 | 4.79 | 4.43 | |
| 7 | 4.58 | 4.33 | |
| 8 | 4.70 | 4.32 | |
| 9 | 4.81 | 4.31 | |
| 10 | 4.72 | 4.39 | |
| 11 | 4.70 | 4.40 | |
| 12 | 4.82 | 4.43 | |
| 13 | 4.78 | 4.33 | |
| 14 | 4.86 | 4.36 | |
| 15 | 4.70 | 4.46 | |
| 16 | 4.57 | 4.36 | |
| 17 | 4.85 | 4.42 | |
| 18 | 4.74 | 4.38 | |
Conclusions
From the data gathered here, one can see that the original hope that all PMT's would behave identically must be abandoned. The histograms in Figure 3, Figure 4 and Figure 5 do not show a significant number of counts for any particular bin. However, the solution to this is simply to run the PMT's all at fixed anode-to-cathode potential. This would eliminate nearly all fluctuations between the various tubes. Finally, it should be noted that, like expected, the average rise times of the PMT's with an LED source is over twice the characteristic rise time of the device. This was what was expected. However, just to be sure, one PMT was tested with a laser and the rise time was 1.97 ns at -1.4 kV.
There were some sources of error that should be considered. The first is the soldering of connections. Every time testing of one device was complete, the connectors were unsoldered from the tested PMT and re-soldered to the untested PMT. Therefore, after being heated and cooled 36 times, there was bound to be some degradation after time. This was done to ensure that there were 16 brand new connectors for the final detectors. The other source of error was the distance from the PMT to the LED in the black box. Alignment was done visually and so there may have been small differences is distance between tests. This would have affected the intensity of light hitting the PMT.
Gluing
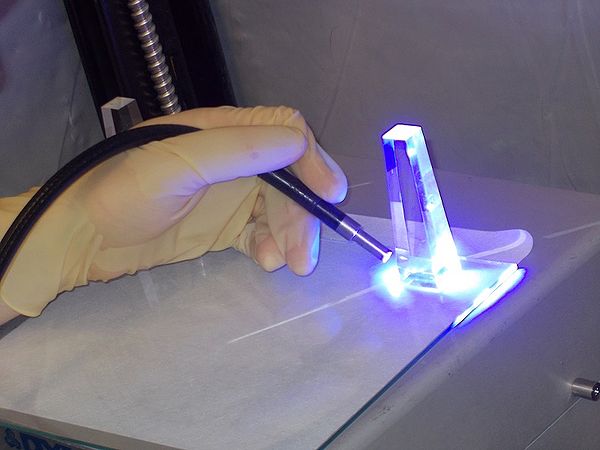
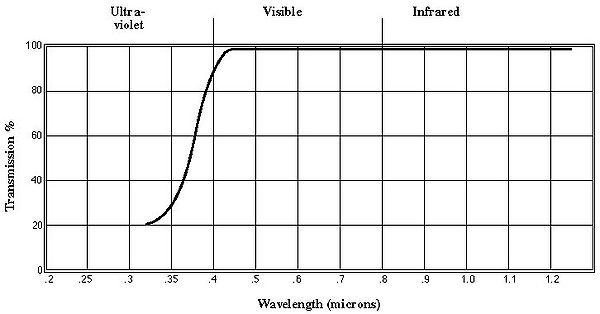
After some trial and error, the glue chosen was Norland Optical Adhesive 87. It is an adhesive that cures clear when exposed to ultraviolet light.
| Typical Properties of NOA 87 | |
|---|---|
| Refractive Index | 1.52 |
| Temperature Range | -30 C to 90 C |
| Viscosity @ 25C | 900-1500cps |
| Elongation at Failure | 13% |
| Modulus (PSI) | 209,700 |
| Tensile Strength | 4,880 |
| Hardness - Shore D | 50 |
Wrapping
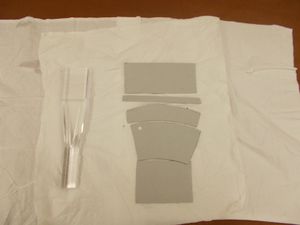
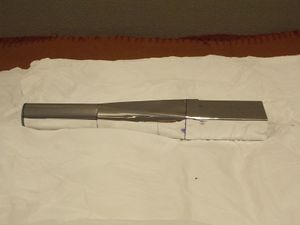
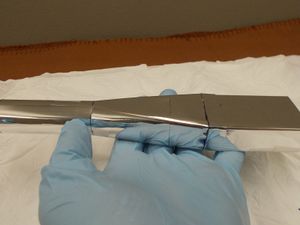
Because we wish to minimize wrinkling, a custom template has been made. Using Mylar, the light guide was wrapped using a trial and error process. From the finalized wrapping a template was constructed from non-corrugated cardboard to make it more practical to use.
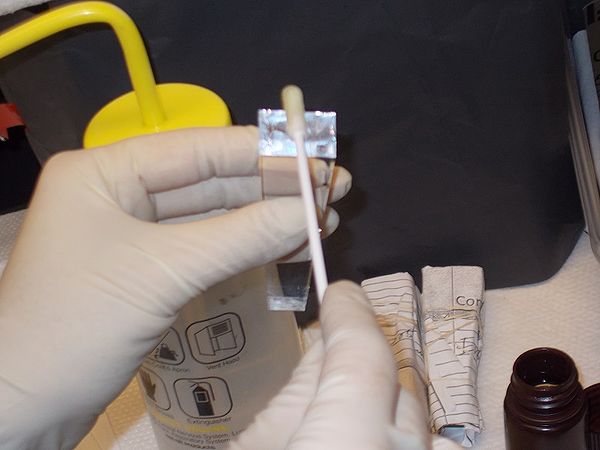
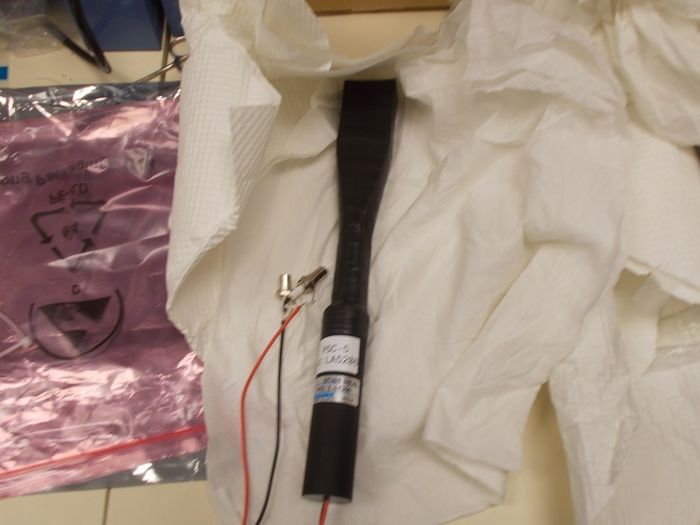
Once a template was completed, the light guide was wrapped with Mylar after being cleaned with distilled water and lent free cloth. Over the Mylar, a layer of Tedlar was added using the same template. The PS counter was then covered with a layer of black electrical tape and ready to be tested.
Cosmic Ray Detecting
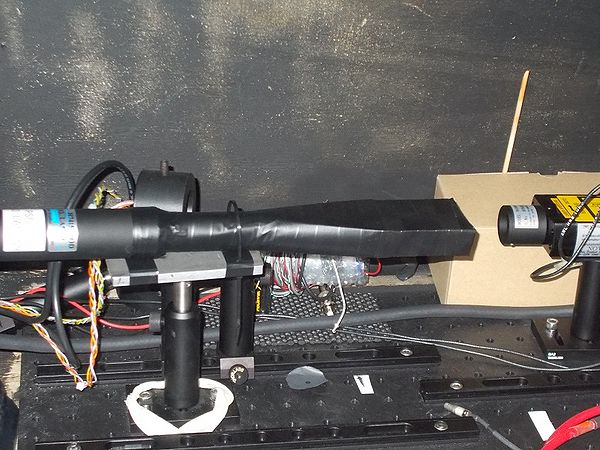
We tested the wrapped PS detector in the same manner as the PMTs with one exception: Instead of using light from an LED, we let cosmic ray muons trigger the scintillator and let the device operate as it would normally.
Nate, edit this however you'd like. I just thought I would upload some files.
