Difference between revisions of "LE algo"
| Line 94: | Line 94: | ||
|} | |} | ||
| + | {| border="0" cellpadding="2" | ||
| + | |width="420pt"| | ||
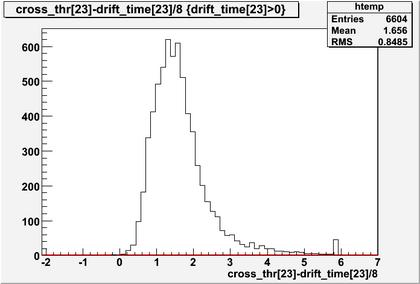
| + | [[Image:run_31659_track15_drift_to_threshold_time.png|thumb|420px|2100V data: Number of 8ns bins between interpolated drift-time and high (5sigma) threshold crossing]] | ||
| + | |} | ||
Revision as of 10:54, 24 May 2011
- Page still under edit* read at your own risk (and don't believe any of it... yet)*
Results using Gerard's leading edge algo to extract drift-time from CDC prototype cosmics data
- 50/50 mixed Ar, CO2
- Recalibrated MFCs
- Outer plenum added to CDC prototype to prevent leaks
- New modified HVB
- 2050V
- Modified preamp4 (terminating resistors removed)
- Prototype tilted at 45o to enclosing scintillators (scints trigger the daq)
The original algorithm is here LE algo It takes a number of samples from the ADC data, interpolates 4 extra points between each sample, convolutes them with the filter to give an approximation to the original pre-sampled data, and returns the first value above a predefined threshold. There are a variety of implementations below. The "without interpolation" results are from a simple comparison between ADC data and threshold.
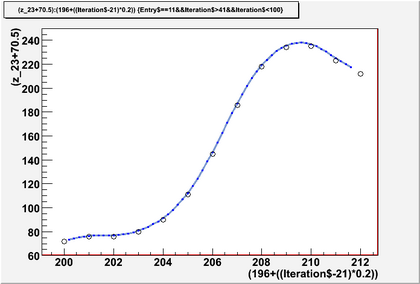
Below: excerpt from one event in one straw showing interpolated and sampled fADC data
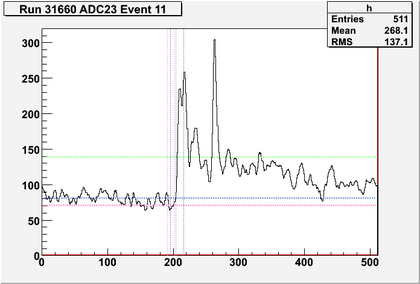
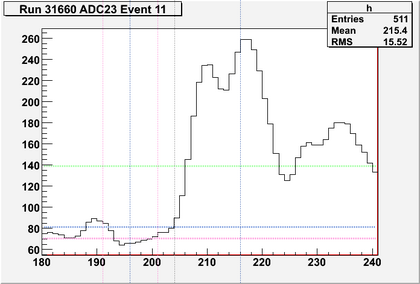
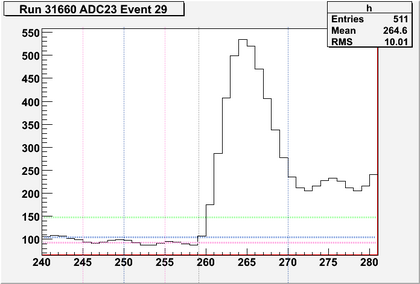
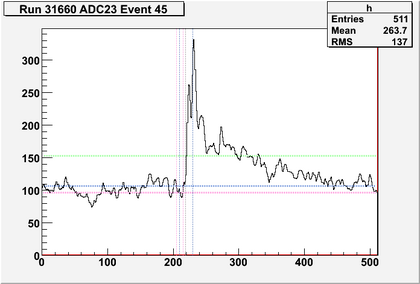
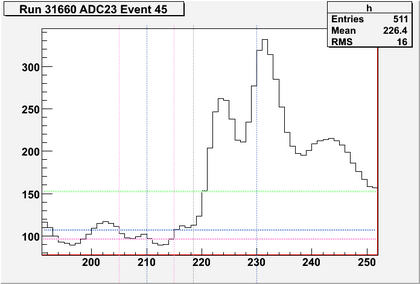
Below: Events with ADC data going above pedestal mean + 5 pedestal sigma are selected. 20 samples starting 10 samples before the threshold crossing are sent to the LE algo after subtracting mean pedestal. Pedestal mean is for 10 samples starting 15 samples before the threshold crossing. The threshold for the LE algo is 2 pedestal sigma. Pedestal sigma is for 100 early samples in 100 events. Left: all samples Right: zoomed
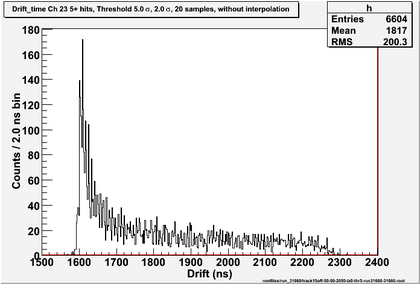
Left: drift-time with interpolation; Right: no interpolation
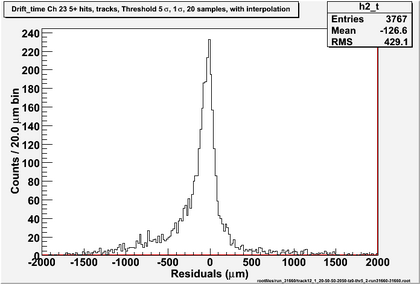
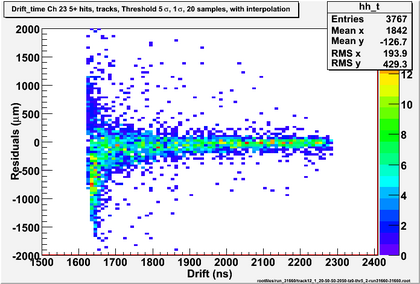
Below: Only events where a track can be fitted are selected. Tzero was obtained by fitting a straight line to the leading edge of the drift time histo (between the overall maximum and the minimum preceding it) and taking the value where it crosses the x-axis (this needs work). First the drift-time histo was put into 4ns bins to unify any double-maxima in the histogram.
Negative residuals come from a tzero that is too small (or drift time that is too large). 2 sigma is ~ 20 in ADC value, a little late. Lowering the LE threshold makes it more likely to accept noise before the signal and so the # tracked events decreases slightly. However the LE search window can be tightened and a constant can be added to tzero.
Move the start of the LE window up to 1 bin after the 2nd pedestal window, 3 bins before the initial threshold crossing.
Below: Old UNinterpolated (accidentally) results for LE threshold of 1 sigma and original LE search window (Events with ADC data going above pedestal mean + 5 sigma are selected. Events with 5 or more hits are selected. 20 samples starting 10 samples before the threshold crossing are sent to the LE algo after subtracting mean pedestal. The threshold for the LE algo is 1 sigma.)
