Difference between revisions of "Minutes-11-17-2016"
From GlueXWiki
| Line 35: | Line 35: | ||
- Naomi showed the effect of the alcohol on the CDC - increased total drift time by a little and increased amplitude (see link). | - Naomi showed the effect of the alcohol on the CDC - increased total drift time by a little and increased amplitude (see link). | ||
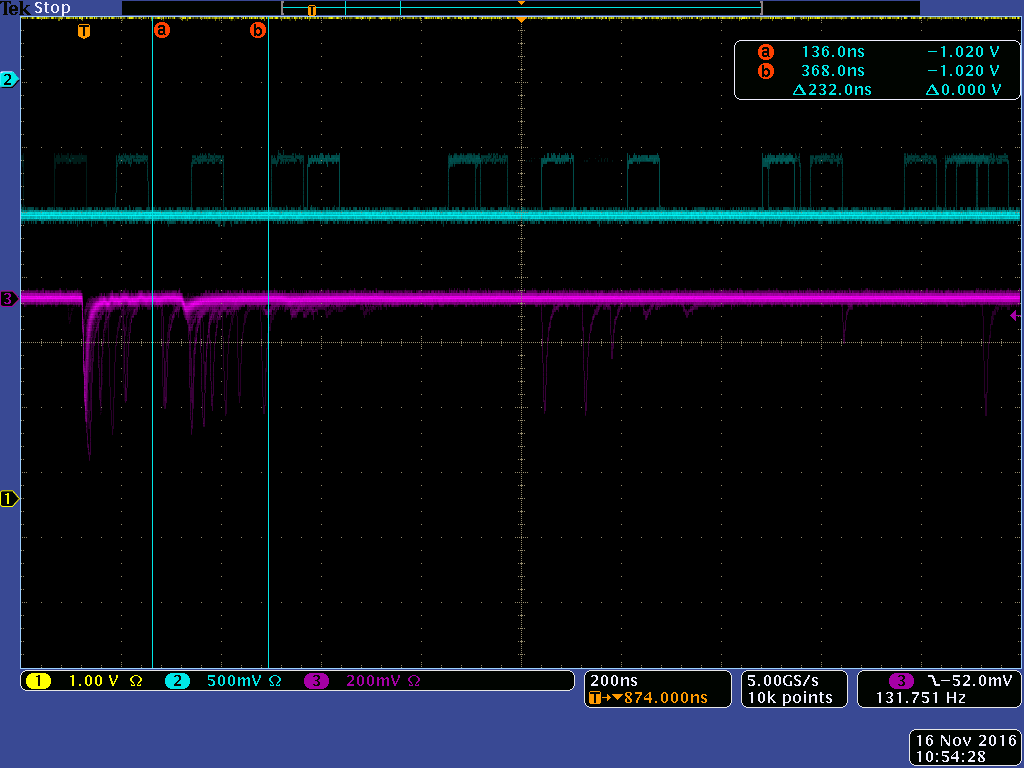
| − | - Fernando and Lubomir studied the noise in the Hall related to high trigger rates. The noise is seen on the FDC TDCs coming from the input to the discriminators. Scope screen - yellow is the trigger at the SD, pink is the discriminator output. The noise | + | - Fernando and Lubomir studied the noise in the Hall related to high trigger rates. The noise is seen on the FDC TDCs coming from the input to the discriminators. Scope screen - yellow is the trigger at the SD, pink is the discriminator output. On the spectral analyzer the noise had equidistant peaks - ~3.3 MHz apart for 60 kHz trigger rate and ~10 MHz apart for 15 kHz trigger rate - with an amplitude ~10dB in a wide range of 100MHz. The noise is seen everywhere on the crates and also along the signal cables. Fernando: the noise is low, but maybe combined from all the crates might indues measurable signals on the wires (Lubomir), as is the case. Discussions with Sergey after the meeting - the data rates (due to the noise) on some TDC crates are very high limiting the DAQ performance for the high intensity running. |
== Tracking == | == Tracking == | ||
| − | - Mike | + | - Mike reported on his plan for the FDC alignment (see the link above). |
- Mike made a presentation (linked) on his studies of the CDC/FDC transition region. He used straight tracks through the FDC and looked at the residuals w.r.t. the CDC wires. This is the procedure used by Lubomir to find the CDC offsets w.r.t. FDC except that Mike used the standard Simon's tracking. Mike showed there's ~20% more tracks in the 10-30 deg region after applying the offsets. These offsets will be included for the next analysis run. | - Mike made a presentation (linked) on his studies of the CDC/FDC transition region. He used straight tracks through the FDC and looked at the residuals w.r.t. the CDC wires. This is the procedure used by Lubomir to find the CDC offsets w.r.t. FDC except that Mike used the standard Simon's tracking. Mike showed there's ~20% more tracks in the 10-30 deg region after applying the offsets. These offsets will be included for the next analysis run. | ||
Revision as of 18:15, 18 November 2016
November 17, 2016 Drift Chamber meeting
Connection
- Instructions for Bluejeans meeting connection
- Meeting ID: 290664653
Headline text
- To join via a Web Browser, go to the page [1] https://bluejeans.com/290664653.
Agenda
- Preparations for the fall 2016 run
- CDC (Beni/Naomi/Mike)
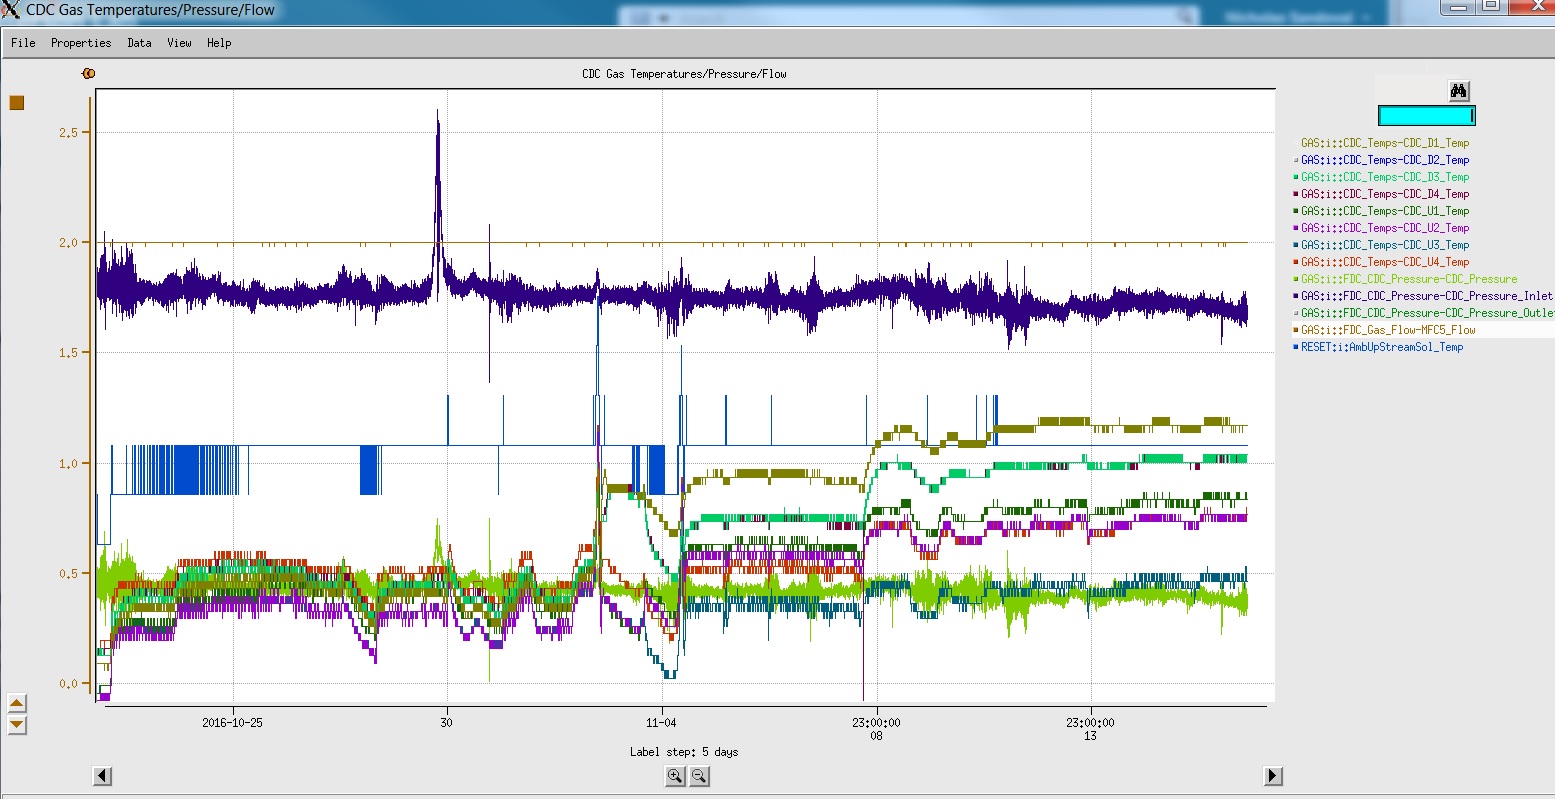
- CDC temperatures (Naomi, Nick)
- alcohol effect (Naomi)
- FDC (Lubomir)
- Noise studies noise on FDC discrminators(Fernando, Lubomir)
- CDC (Beni/Naomi/Mike)
- Tracking
- Tracking Alignment (Mike)
- mcsmear updates (all)
- fADC125 (Naomi, Cody, Beni)
- Other