File list
From GlueXWiki
This special page shows all uploaded files.
First page |
Previous page |
Next page |
Last page |
| Date | Name | Thumbnail | Size | Description | Versions |
|---|---|---|---|---|---|
| 09:32, 26 August 2008 | Kuraray 3HF MC sr 65cm.gif (file) |  |
14 KB | XP2020 response on the electrons from a Sr90 source positioned on top of the 3HF MC green fiber from Kuraray at 65cm. | 1 |
| 09:25, 26 August 2008 | Kuraray 78MC sr 194cm.gif (file) |  |
14 KB | XP2020 response on the electrons from a Sr90 source positioned on top of the 78MC blue fiber from Kuraray at 194cm. | 1 |
| 09:25, 26 August 2008 | Kuraray 78MC sr 94cm.gif (file) |  |
14 KB | XP2020 response on the electrons from a Sr90 source positioned on top of the 78MC blue fiber from Kuraray at 94cm. | 1 |
| 09:24, 26 August 2008 | Kuraray 78MC sr 61cm.gif (file) |  |
14 KB | XP2020 response on the electrons from a Sr90 source positioned on top of the 78MC blue fiber from Kuraray at 61cm. | 1 |
| 09:15, 26 August 2008 | Kuraray 81MC sr 194cm.gif (file) |  |
14 KB | XP2020 response on the electrons from a Sr90 source positioned on top of the 81MC blue fiber from Kuraray at 194cm. | 1 |
| 09:14, 26 August 2008 | Kuraray 81MC sr 165cm.gif (file) |  |
14 KB | XP2020 response on the electrons from a Sr90 source positioned on top of the 81MC blue fiber from Kuraray at 165cm. | 1 |
| 09:13, 26 August 2008 | Kuraray 81MC sr 65cm.gif (file) |  |
13 KB | XP2020 response on the electrons from a Sr90 source positioned on top of the 81MC blue fiber from Kuraray at 65cm. | 1 |
| 18:17, 25 August 2008 | Trigger scintillator response.gif (file) |  |
11 KB | ADC spectrum of the Trigger scintillator. The PMT is a Hamamatsu H3165-10 PMT with a small scintillator attached. | 1 |
| 18:11, 25 August 2008 | Xp2020 led response 2200V B.gif (file) |  |
13 KB | ADC spectrum of xp2020 at -2200V response to blue LED biased at -7.90V. mu is the mean number of photo electrons given by the fit to be about 2.5 | 1 |
| 18:09, 25 August 2008 | Xp2020 led response 2200V A.gif (file) |  |
14 KB | ADC spectrum of the xp2020 PMT response to a blue LED biased with -7.89V | 1 |
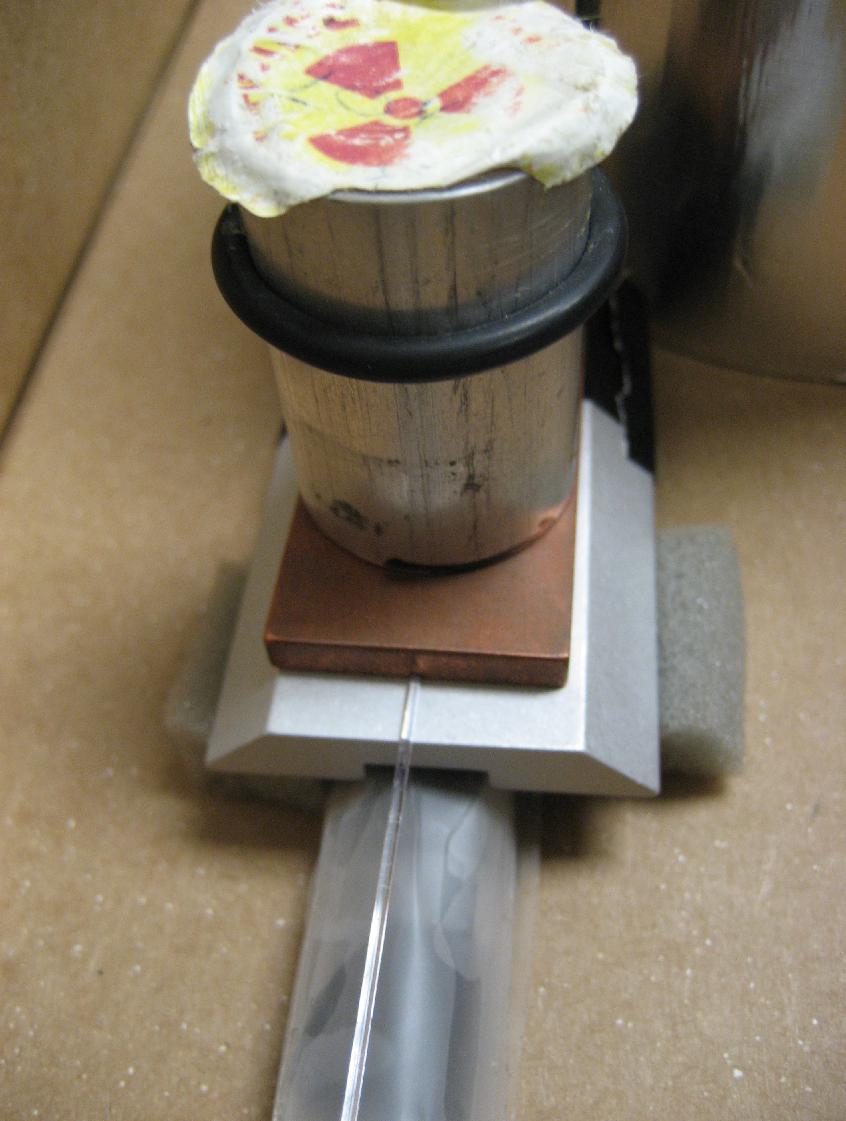
| 10:24, 25 August 2008 | Sr source.jpg (file) |  |
82 KB | Sr90 source placed above collimator with scintillation fiber and trigger scintillator detector below. | 1 |
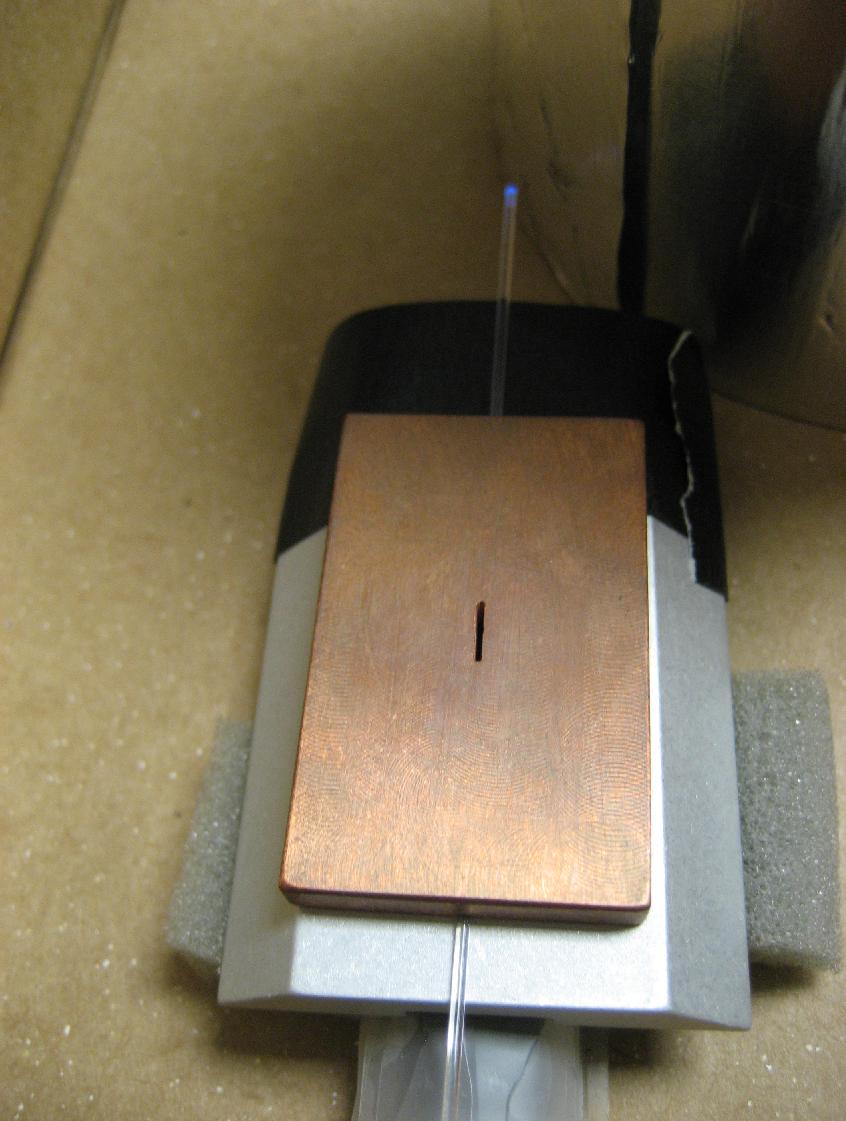
| 10:23, 25 August 2008 | Collimation.jpg (file) |  |
91 KB | collimation of electrons from Sr90 source. Trigger scintillator is below. | 1 |
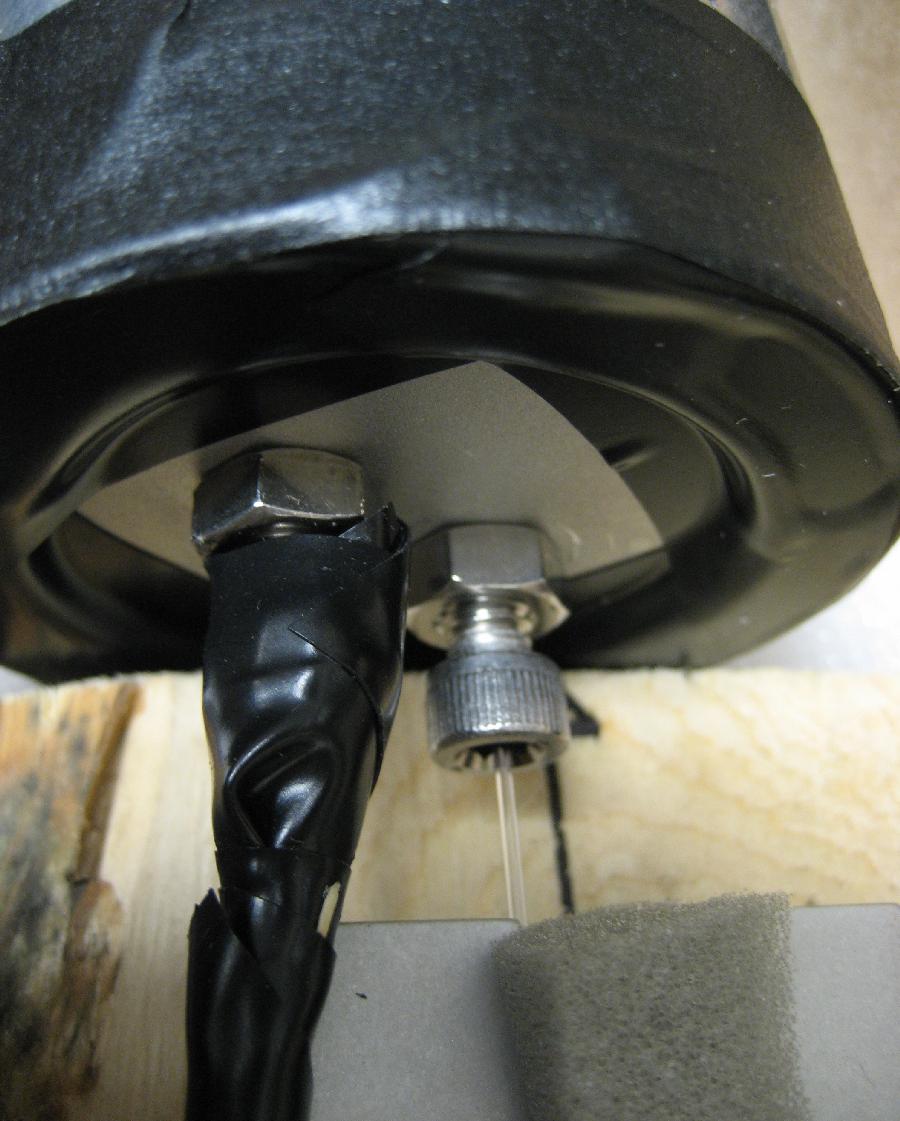
| 10:22, 25 August 2008 | Fiber coupling.jpg (file) |  |
100 KB | 1 | |
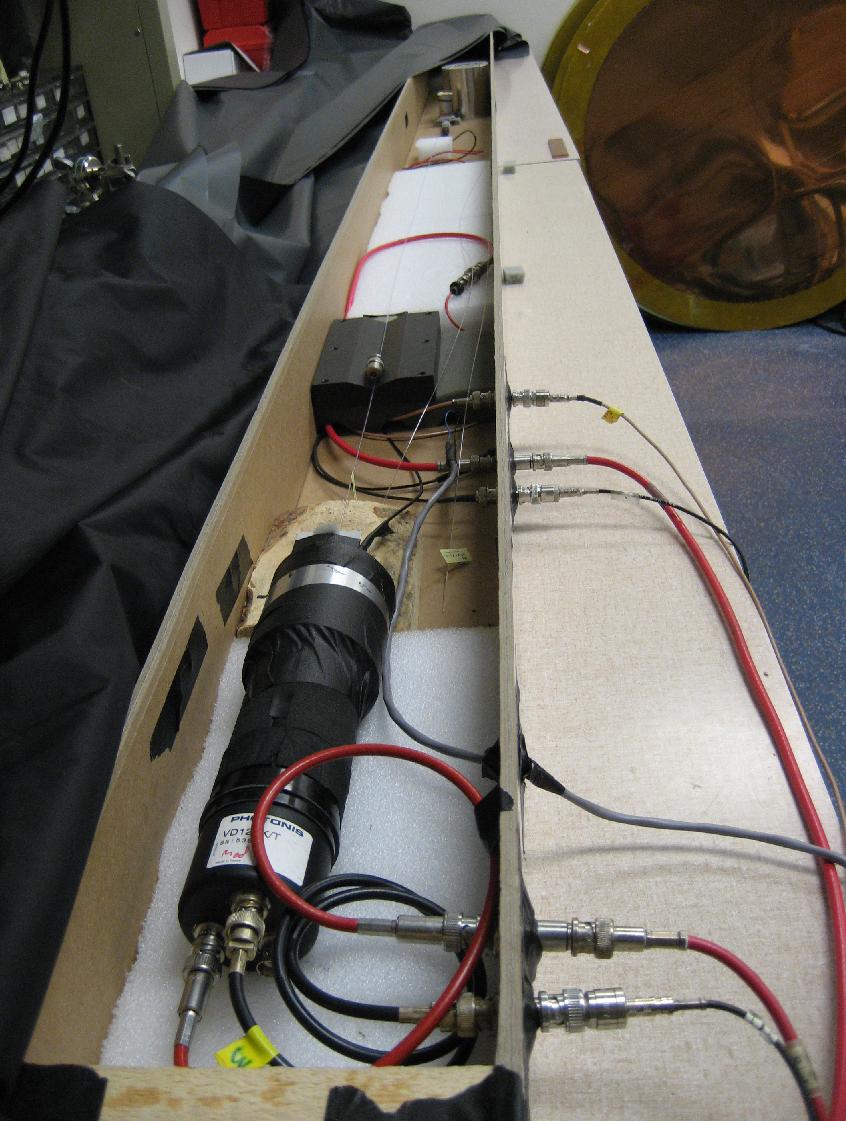
| 09:02, 25 August 2008 | Fiber test stand darkbox.jpg (file) |  |
132 KB | 1 | |
| 08:44, 25 August 2008 | Fiber test electronics setup.pdf (file) | 36 KB | sketch of the NIM electronics for the fiber test at JLAB | 1 | |
| 19:00, 21 August 2008 | Fine mesh pmt test overview.pdf (file) | 303 KB | short over view of the fine mesh pmt test done in Hall-A in the gap of Big-Bite | 1 | |
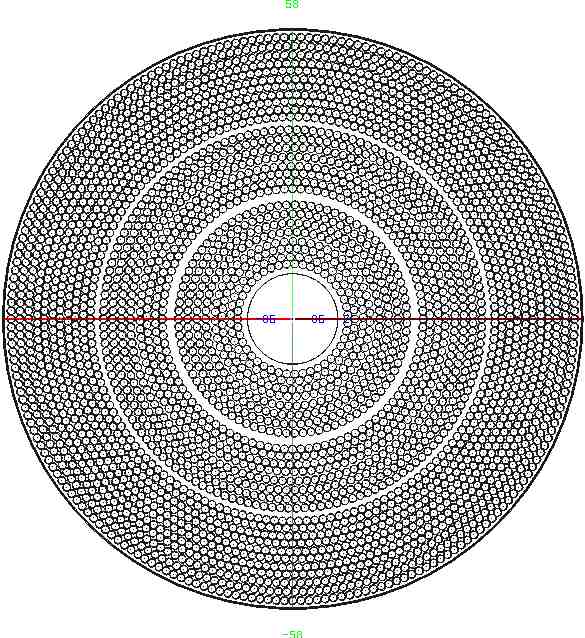
| 10:31, 17 July 2008 | Cdc closedpacking.jpg (file) |  |
97 KB | The closed packing allows for 3 more layers for the same CDC diameter. These layers are set as stereo layers set at +6 degree as the outermost layers of the CDC. | 1 |
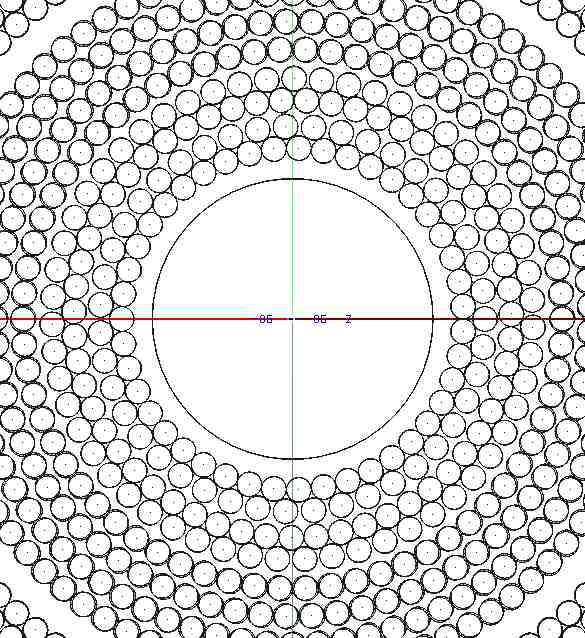
| 10:27, 17 July 2008 | Cdc closedpacking zoom.jpg (file) |  |
74 KB | centeral view of CDC (z=0) cross section with close-packing of axial layers. all axial layers come in pairs. | 1 |
| 10:24, 17 July 2008 | Cdc layers shifted.jpg (file) |  |
93 KB | view of the CDC at the center (z=0) with axial layers rotated around z axis to avoid lineup of straws. | 1 |
| 10:17, 17 July 2008 | Bcal 3x3.jpg (file) |  |
18 KB | The BCAL 3x3 inner readout scheem | 1 |
| 10:16, 17 July 2008 | Bcal 6x4.jpg (file) |  |
21 KB | BCAL wedge with 6x4 inner readout scheem and aluminum plate on the inside. | 1 |
| 10:12, 17 July 2008 | Fdc cableupstream.jpg (file) |  |
19 KB | FDC package geometry with first lowest layer cables of FDC1 package running upstream | 1 |
| 18:52, 2 July 2008 | Bcal cdc gap.pdf (file) | 69 KB | gap between CDC and BCAL for cables from FDCs | 1 | |
| 18:52, 2 July 2008 | Det cabling.pdf (file) | 29 KB | geometry file, implementation of BCAL, CDC and FDC cables | 1 | |
| 18:51, 2 July 2008 | Bcal 3x3.pdf (file) | 427 KB | geometry file, implementation of 3x3 Bcal inner readout | 1 | |
| 18:50, 2 July 2008 | Bcal 4x6.pdf (file) | 168 KB | geometry file, implemenation of BCAL 4x6 inner readout | 1 | |
| 14:55, 5 June 2008 | Gxroot.pdf (file) | 66 KB | how to use the root geometry in DANA | 1 | |
| 17:35, 5 February 2008 | Feu noise cwbase bestbase lowestnoise.jpg (file) |  |
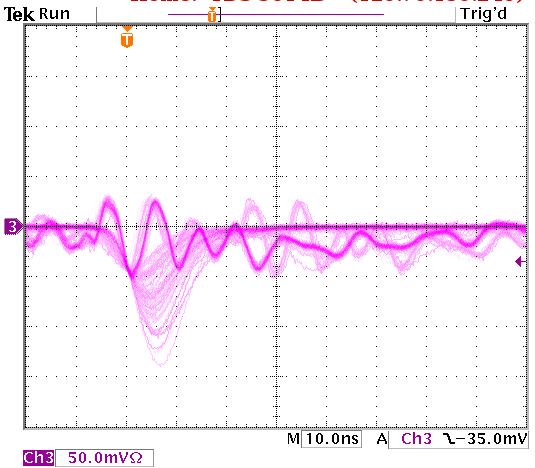
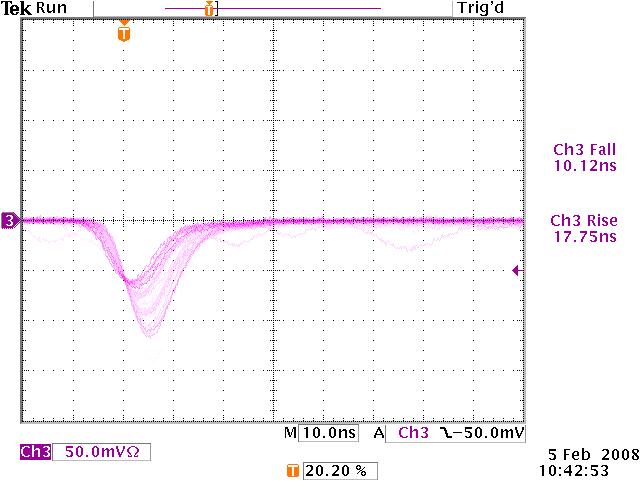
51 KB | CW-base with very low noise. Lowest noise of all bases that were looked at. | 1 |
| 15:09, 5 February 2008 | Feu noise cwbase.jpg (file) |  |
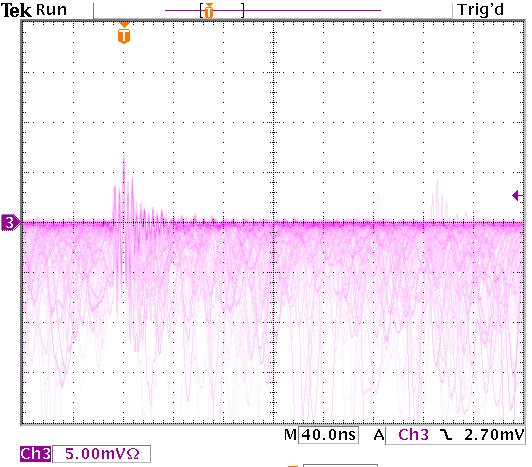
46 KB | Signal and noise (scope shot) from one of the PMTs during the test to measure the temperature of the CW-Bases mounted in the platic block. The noise is from the base itself. | 1 |
| 15:06, 5 February 2008 | Feu signalB cwbase.jpg (file) |  |
46 KB | Signal (cope shot) from one of the four PMTs when testing the temperature of the CW-base mounted in the plastic block. | 1 |
| 14:42, 5 February 2008 | Cosmics response LGwrapped.jpg (file) |  |
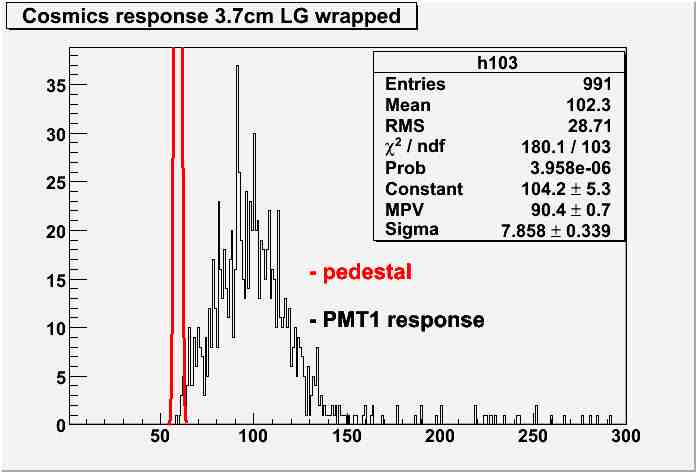
27 KB | ADC spectrum of cosmic ray data. The PMT is coupled to the lead glass through a 3.7cm long light guide that was glued to the PMT with epoxy and attached to the lead glass with optical grease. The light guide is wrapped in aluminized mylar. | 1 |
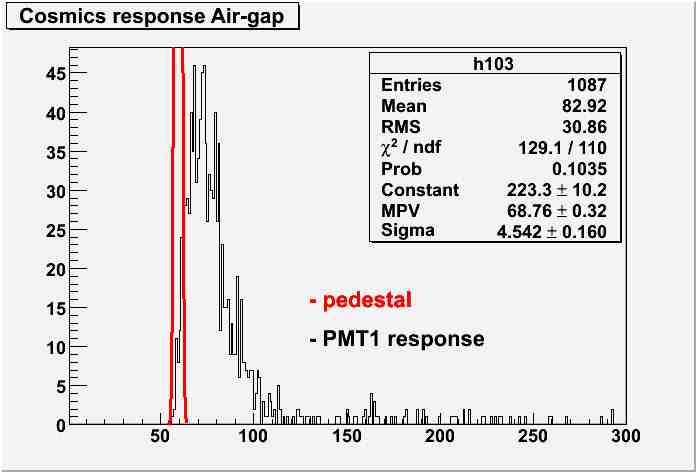
| 14:40, 5 February 2008 | Cosmics response airgap.jpg (file) |  |
26 KB | 1 | |
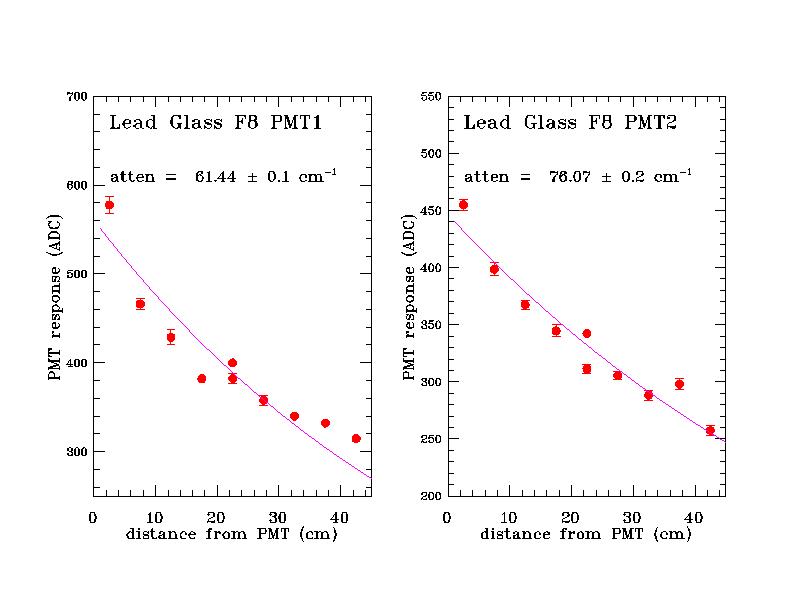
| 14:51, 29 January 2008 | Leadglass F8 atten bothpmts.jpg (file) |  |
47 KB | 1 | |
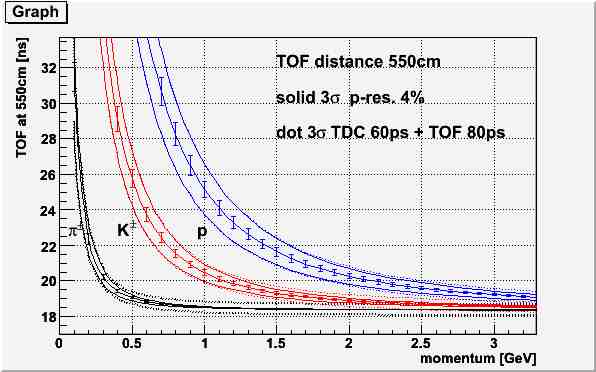
| 19:50, 24 January 2008 | Tofres 550cm tof.jpg (file) |  |
28 KB | 1 | |
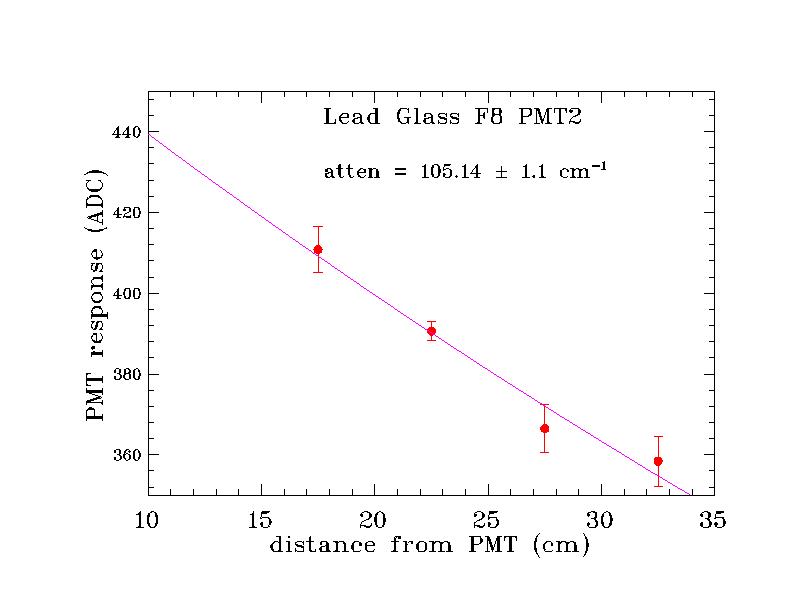
| 10:48, 14 November 2007 | Leadglass F8 atten pmt2.jpg (file) |  |
35 KB | plot the ADC landau peak position (MPV) from the fit as a function of the position of the sctintillator trigger along the lead glass block. Then fit an exponential function of the form f(x)=a+exp(x/b) where b is the attenuation factor. | 1 |
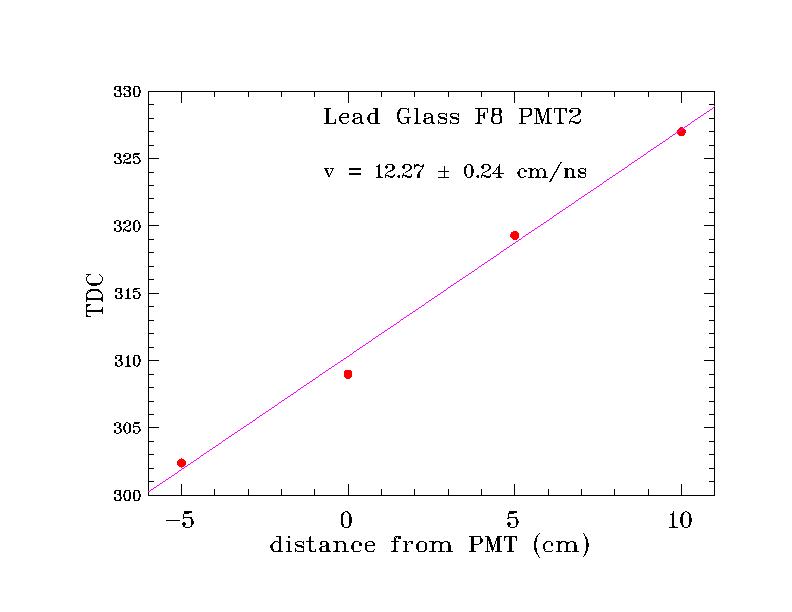
| 10:44, 14 November 2007 | Leadglass F8 velo pmt2.jpg (file) |  |
32 KB | plot the TOF peak position as function of the cosmic ray trigger sctintillator position and fit a line to the points. The inverse of the slope is proportional to the signal propagation velocity in the lead glass. | 1 |
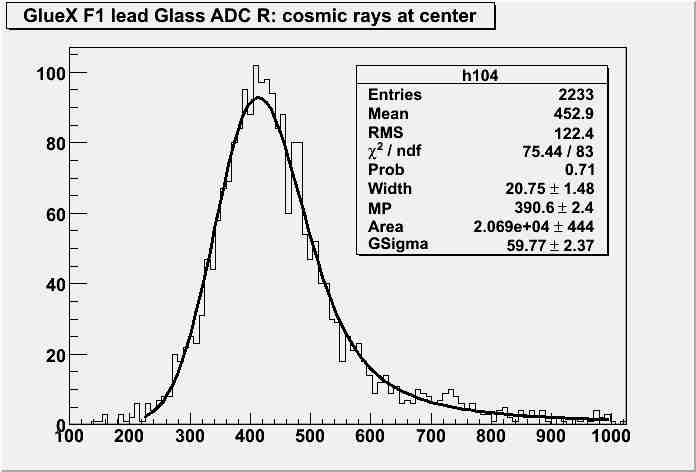
| 10:42, 14 November 2007 | Lg adcR center.jpg (file) |  |
26 KB | ADC spectrum of PMT response with the cosmic trigger sctintillators positioned at the center of the lead glass block. The fit is a landau convoluted with a gaussian. The PMT used are XP2262. | 1 |
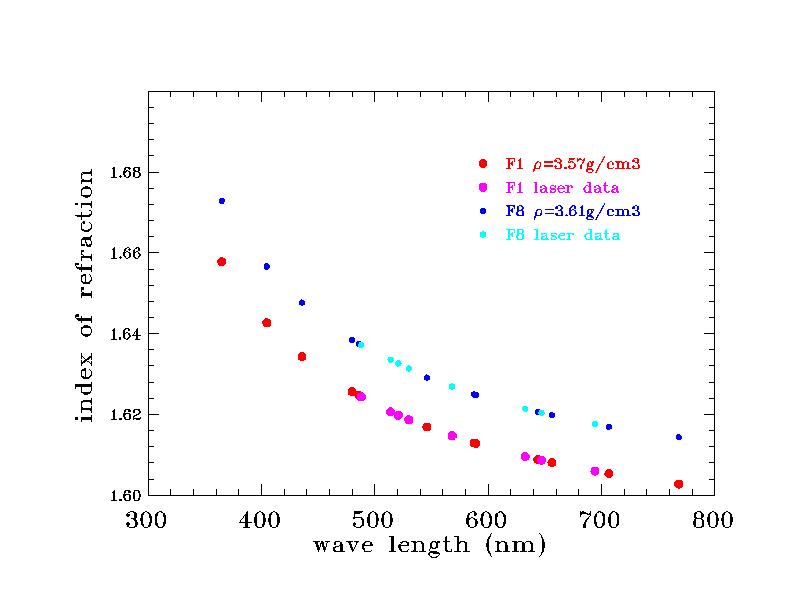
| 13:49, 9 November 2007 | Lead glass refrac index.jpg (file) |  |
35 KB | lead glass refractive index for type F1 and F8 as function of wavelength | 1 |
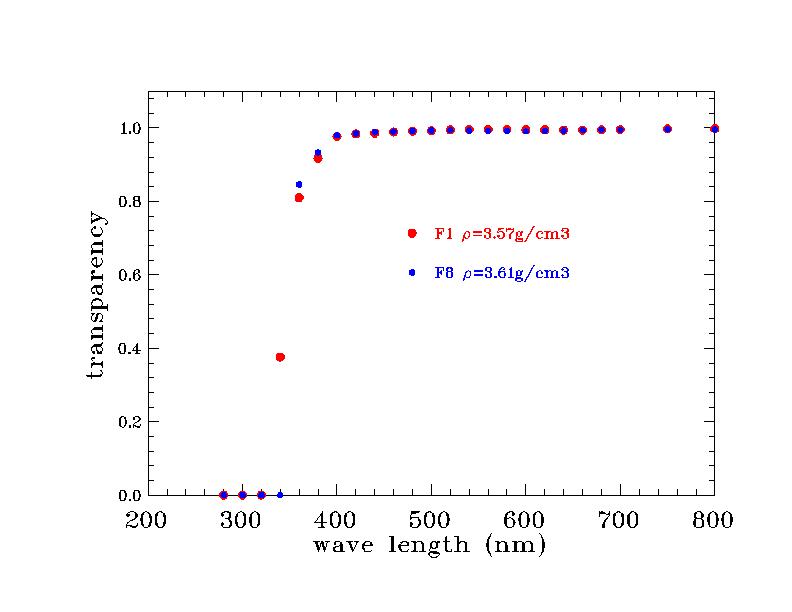
| 13:47, 9 November 2007 | Lead glass transmission.jpg (file) | 33 KB | light transmission in lead glass type F1 and F8 as function of wavelength | 1 | |
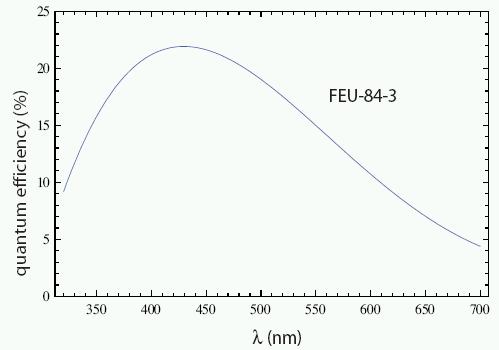
| 14:24, 1 November 2007 | Qe feu843.jpg (file) |  |
16 KB | quantum efficiency for FEU-84-3 PMT | 1 |
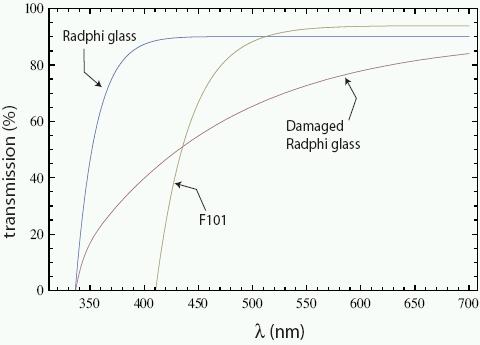
| 16:33, 30 October 2007 | Raddam.jpg (file) |  |
20 KB | lead glass transparency dependence on wavelength | 1 |
| 14:00, 10 September 2007 | Part mult vs angl 1.jpg (file) |  |
34 KB | 1 | |
| 13:43, 10 September 2007 | Part mult vs angl 2b.jpg (file) |  |
32 KB | 1 | |
| 13:42, 10 September 2007 | Part mult vs angl 2a.jpg (file) |  |
38 KB | 1 | |
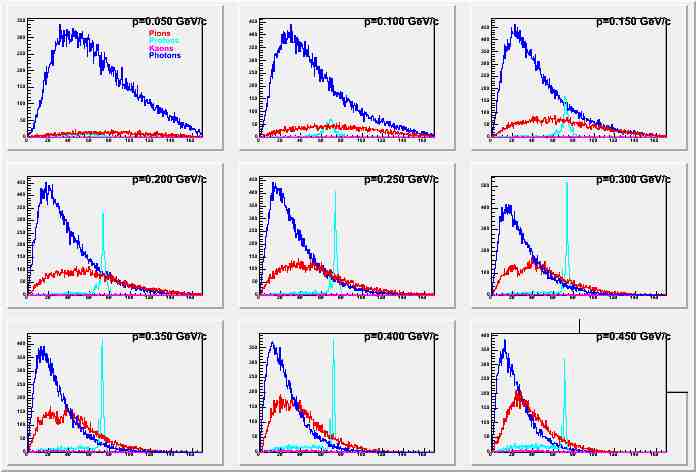
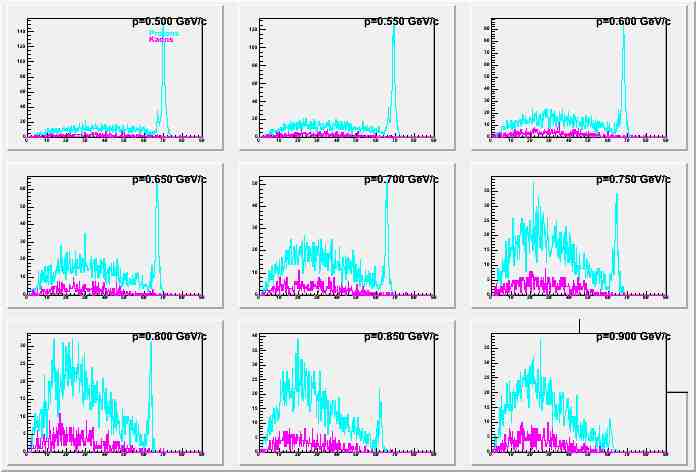
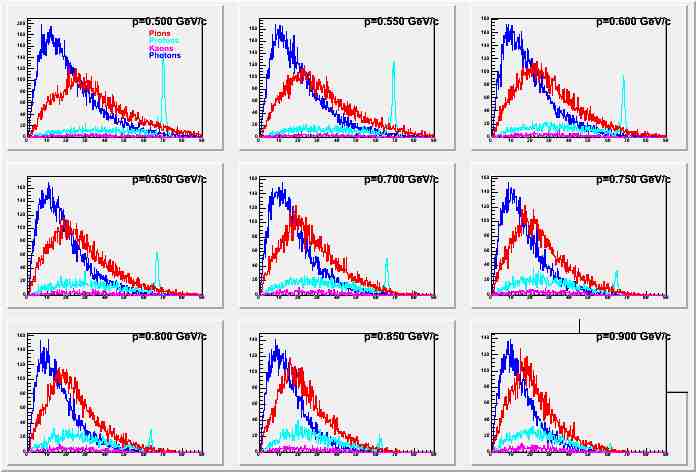
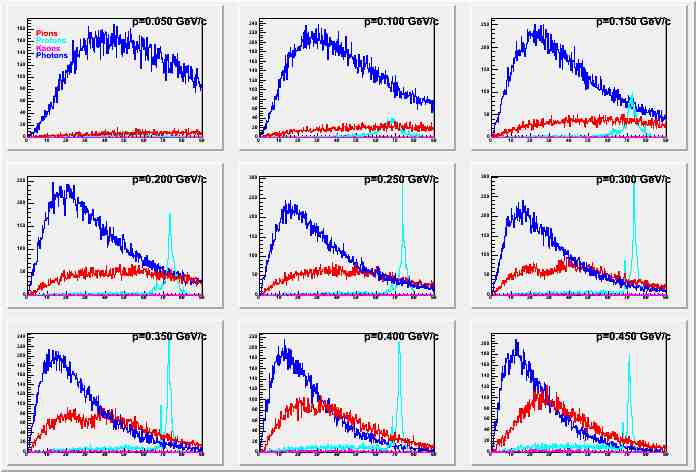
| 13:41, 10 September 2007 | Part mult vs angl 1a.jpg (file) |  |
40 KB | Angular distribution of low momentrum particles geneated by pythia | 1 |
| 13:39, 10 September 2007 | Pythia lowp angular dist1.jpg (file) |  |
34 KB | Angular distrubion of low momentum particles generated in pythia | 1 |
| 09:28, 24 July 2007 | Tofstat.pdf (file) | 386 KB | 3 | ||
| 09:28, 24 July 2007 | Tofstatus.pdf (file) | 234 KB | 2 | ||
| 11:55, 17 July 2007 | Flowchart.pdf (file) | 9 KB | 1 | ||
| 18:26, 25 June 2007 | Tofdigi1.pdf (file) | 18 KB | TOF digitizatino status June 26 2007 | 1 |
First page |
Previous page |
Next page |
Last page |