Difference between revisions of "CDC signal integration new"
| (17 intermediate revisions by the same user not shown) | |||
| Line 2: | Line 2: | ||
Comparison with old (underpowered preamp) data is at [[CDC_signal_integration]] | Comparison with old (underpowered preamp) data is at [[CDC_signal_integration]] | ||
| − | |||
Run numbers are 31809 (horiz) 31810 (45 deg) and 31811 (30 deg) at 3.0V, 2.09kV | Run numbers are 31809 (horiz) 31810 (45 deg) and 31811 (30 deg) at 3.0V, 2.09kV | ||
| − | + | <div style="background-color:#eef" id="check_ped"> | |
| − | + | <h2>Check pedestal width and stability</h2> | |
| − | + | ||
{| border="0" cellpadding="2" | {| border="0" cellpadding="2" | ||
|+Pedestal height | |+Pedestal height | ||
| Line 22: | Line 20: | ||
|[[Image:run_31810_sig20.png|thumb|x180px|45 degrees, LV 3.0V, HV 2090V]] | |[[Image:run_31810_sig20.png|thumb|x180px|45 degrees, LV 3.0V, HV 2090V]] | ||
|} | |} | ||
| + | </div> | ||
| + | <br/> | ||
| + | <div style="background-color:#efe" id="find_thr"> | ||
| + | <h2>Find hit threshold to cut above noise</h2> | ||
{| border="0" cellpadding="2" | {| border="0" cellpadding="2" | ||
| Line 40: | Line 42: | ||
Data below are for hit threshold 5 x pedestal sigma | Data below are for hit threshold 5 x pedestal sigma | ||
| + | </div> | ||
| + | <br /> | ||
| − | <div style="background-color:#fcf" id=" | + | <div style="background-color:#fcf" id="dEdx_attempts1"> |
| − | Try to calculate dE/dx | + | <h2>Try to calculate dE/dx</h2> |
| − | (A) integrate signal for 700 ns | + | Find dE and then divide by track length (calculated in the plane parallel to the endplates). Results should scale with the tilt of the prototype. |
| + | Try the following for dE: | ||
| + | <ul><li> | ||
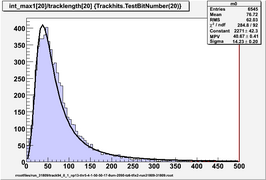
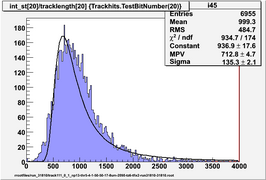
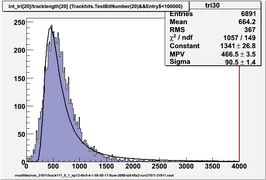
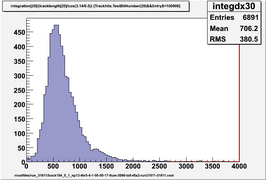
| + | (A) integrate signal for 700 ns </li><li> (B) position of first max in amplitude</li><li> (C) integrate signal up to position of first max in amplitude</li><li> (D) integrate signal up to end of signal (t0+720ns)</li><li> (E) as (D) but subtract a linearly increasing pedestal which matches the ADC values at the start and end of signal</li></ul> | ||
{| border="0" cellpadding="2" | {| border="0" cellpadding="2" | ||
| Line 58: | Line 65: | ||
|[[Image:run_31810_maxampdx_unscaled.png|thumb|x180px|Tilted at 45 degrees, LV 3.0V, HV 2090V]] | |[[Image:run_31810_maxampdx_unscaled.png|thumb|x180px|Tilted at 45 degrees, LV 3.0V, HV 2090V]] | ||
|} | |} | ||
| − | Ratio of fit MPV for horizontal : 30 degr : 45 degr data | + | Ratio of fit MPV for horizontal : 30 degr : 45 degr data is 16.9 : 21.4 : 25.7 or 1 : 1.27 : 1.52 |
Ratio of vertical path lengths should be 1 : 1.16 : 1.45 | Ratio of vertical path lengths should be 1 : 1.16 : 1.45 | ||
| Line 67: | Line 74: | ||
|[[Image:run_31810_intmax1dx_unscaled.png|thumb|x180px|Tilted at 45 degrees, LV 3.0V, HV 2090V]] | |[[Image:run_31810_intmax1dx_unscaled.png|thumb|x180px|Tilted at 45 degrees, LV 3.0V, HV 2090V]] | ||
|} | |} | ||
| − | Ratio of fit MPV for horizontal : 30 degr : 45 degr data | + | Ratio of fit MPV for horizontal : 30 degr : 45 degr data is 40.7 : 54.5 : 69.2 or 1 : 1.34 : 1.70 |
| + | |||
| + | {| border="0" cellpadding="2" | ||
| + | |+(D) signal integrated from start to end of signal/tracklength | ||
| + | |[[Image:run_31809_track111_intst.png|thumb|x180px|No tilt, LV 3.0V, HV 2090V]] | ||
| + | |[[Image:run_31811_track111_intst.png|thumb|x180px|Tilted at 30 degrees, LV 3.0V, HV 2090V]] | ||
| + | |[[Image:run_31810_track111_intst.png|thumb|x180px|Tilted at 45 degrees, LV 3.0V, HV 2090V]] | ||
| + | |} | ||
| + | |||
| + | {| border="0" cellpadding="2" | ||
| + | |+(E) signal integrated start to end of signal, with linearly rising pedestal / track length | ||
| + | |[[Image:run_31809_track111_inttri.png|thumb|x180px|No tilt, LV 3.0V, HV 2090V]] | ||
| + | |[[Image:run_31811_track111_inttri.png|thumb|x180px|Tilted at 30 degrees, LV 3.0V, HV 2090V]] | ||
| + | |[[Image:run_31810_track111_inttri.png|thumb|x180px|Tilted at 45 degrees, LV 3.0V, HV 2090V]] | ||
| + | |} | ||
</div> | </div> | ||
| − | <div style="background-color:#ccf"> | + | |
| − | + | <div style="background-color:#ccf" id="dEdx_attempts2"> | |
| + | <h2>Same data as previous section with path lengths scaled by 1/cos(tilt angle)</h2> | ||
Track length is calculated in the plane parallel to the endplates (no z information) so I scaled it by the tilt of the prototype for the 45 degree data, the upper cosmic trigger scintillator is high up enough that the cosmics are ~ vertical. | Track length is calculated in the plane parallel to the endplates (no z information) so I scaled it by the tilt of the prototype for the 45 degree data, the upper cosmic trigger scintillator is high up enough that the cosmics are ~ vertical. | ||
| Line 89: | Line 111: | ||
|[[Image:run_31810_maxampdx.png|thumb|x180px|Tilted at 45 degrees, LV 3.0V, HV 2090V]] | |[[Image:run_31810_maxampdx.png|thumb|x180px|Tilted at 45 degrees, LV 3.0V, HV 2090V]] | ||
|} | |} | ||
| − | + | Landau fit MPVs are 16.9 (horizontal), 18.4 (30deg) and 18.1 (45 deg). Ratio of fit MPV for horizontal : 30 degr : 45 degr data is 1 : 1.09 : 1.07 | |
| Line 99: | Line 121: | ||
|[[Image:run_31810_intmax1dx.png|thumb|x180px|Tilted at 45 degrees, LV 3.0V, HV 2090V]] | |[[Image:run_31810_intmax1dx.png|thumb|x180px|Tilted at 45 degrees, LV 3.0V, HV 2090V]] | ||
|} | |} | ||
| − | + | Ratio of fit MPV for horizontal : 30 degr : 45 degr data is 40.7 : 47.3 : 48.1 or 1 : 1.16 : 1.18 | |
| + | |||
</div> | </div> | ||
<div id="time_over_threshold"> | <div id="time_over_threshold"> | ||
| − | Look at time over threshold... | + | <h2>Signal duration - Time over threshold</h2> |
| + | Look at time over threshold... | ||
| − | + | Search back from end of sample window until ADC value rises above a threshold, tried 3sigma, 5sigma, 8sigma (sigma= pedestal std dev). The initial hit selection is on 5sigma so all events will pass this. | |
| + | {| border="0" cellpadding="2" | ||
| + | |+Time over threshold 3sigma | ||
| + | |[[Image:run_31809_tot3sig.png|thumb|x180px|No tilt, LV 3.0V, HV 2090V]] | ||
| + | |[[Image:run_31811_tot3sig.png|thumb|x180px|Tilted at 30 degrees, LV 3.0V, HV 2090V]] | ||
| + | |[[Image:run_31810_tot3sig.png|thumb|x180px|Tilted at 45 degrees, LV 3.0V, HV 2090V]] | ||
| + | |} | ||
| + | {| border="0" cellpadding="2" | ||
| + | |+Time over threshold 5sigma | ||
| + | |[[Image:run_31809_tot5sig.png|thumb|x180px|No tilt, LV 3.0V, HV 2090V]] | ||
| + | |[[Image:run_31811_tot5sig.png|thumb|x180px|Tilted at 30 degrees, LV 3.0V, HV 2090V]] | ||
| + | |[[Image:run_31810_tot5sig.png|thumb|x180px|Tilted at 45 degrees, LV 3.0V, HV 2090V]] | ||
| + | |} | ||
| + | {| border="0" cellpadding="2" | ||
| + | |+Time over threshold 8sigma | ||
| + | |[[Image:run_31809_tot8sig.png|thumb|x180px|No tilt, LV 3.0V, HV 2090V]] | ||
| + | |[[Image:run_31811_tot8sig.png|thumb|x180px|Tilted at 30 degrees, LV 3.0V, HV 2090V]] | ||
| + | |[[Image:run_31810_tot8sig.png|thumb|x180px|Tilted at 45 degrees, LV 3.0V, HV 2090V]] | ||
| + | |} | ||
| + | </div> | ||
| + | <div id="change_in_gradient"> | ||
| + | <h2>Signal duration - change in gradient</h2> | ||
| + | Another way to find the peak length is to start at the end of the sample window and work towards the first sample, looking for a rise of 10sigma or more between 2 consecutive chunks of 5 samples summed together. Other similar approaches on this page [[CDC_finding_signal_duration | finding signal duration]] | ||
{| border="0" cellpadding="2" | {| border="0" cellpadding="2" | ||
| − | | | + | |[[Image:run_31809_pklength_track109.png|thumb|x180px|run 31809 (horizontal)]] |
| − | |[[Image: | + | |[[Image:run_31811_pklength_track109.png|thumb|x180px|run 31811 (tilted 30deg)]] |
| − | |[[Image: | + | |[[Image:run_31810_pklength_track109.png|thumb|x180px|run 31810 (tilted 45deg)]] |
|} | |} | ||
| + | </div> | ||
| + | <div id="dEdt_without_trackfitting"> | ||
| + | <h2>dE/dt without trackfitting?</h2> | ||
| + | {| border="0" cellpadding="2" | ||
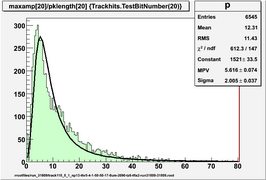
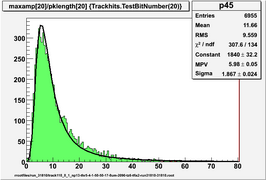
| + | |+Amplitude of first maximum in signal / peak duration (peak length calculated as immediately above) Units of fADC bins/sample | ||
| + | |[[Image:run_31809_maxamp_pklength.png|thumb|x180px|run 31809 (horizontal)]] | ||
| + | |[[Image:run_31811_maxamp_pklength.png|thumb|x180px|run 31811 (tilted 30deg)]] | ||
| + | |[[Image:run_31810_maxamp_pklength.png|thumb|x180px|run 31810 (tilted 45deg)]] | ||
| + | |} | ||
| + | </div> | ||
| + | |||
| + | <h2>Drift times</h2> | ||
{| border="0" cellpadding="2" | {| border="0" cellpadding="2" | ||
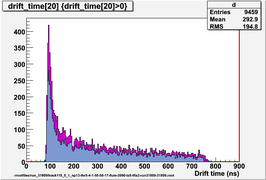
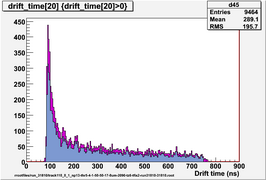
| − | |+ | + | |+Drift times for tracked and untracked hits in ch20 |
| − | |[[Image: | + | |[[Image:run_31809_dt20.png|thumb|x180px|run 31809 (horizontal)]] |
| − | |[[Image: | + | |[[Image:run_31811_dt20.png|thumb|x180px|run 31811 (tilted 30deg)]] |
| + | |[[Image:run_31810_dt20.png|thumb|x180px|run 31810 (tilted 45deg)]] | ||
|} | |} | ||
| + | <h2>Resolution</h2> | ||
{| border="0" cellpadding="2" | {| border="0" cellpadding="2" | ||
| − | |+ | + | |+Resolution ch20 |
| − | |[[Image: | + | |[[Image:run_31809_res1.png|thumb|x180px|run 31809 (horizontal)]] |
| − | |[[Image: | + | |[[Image:run_31811_res1.png|thumb|x180px|run 31811 (tilted 30deg)]] |
| + | |[[Image:run_31810_res1.png|thumb|x180px|run 31810 (tilted 45deg)]] | ||
|} | |} | ||
{| border="0" cellpadding="2" | {| border="0" cellpadding="2" | ||
| − | |+ | + | |+Resolution vs drift distance |
| − | |[[Image: | + | |[[Image:run_31809_res2.png|thumb|x180px|run 31809 (horizontal)]] |
| − | |[[Image: | + | |[[Image:run_31811_res2.png|thumb|x180px|run 31811 (tilted 30deg)]] |
| + | |[[Image:run_31810_res2.png|thumb|x180px|run 31810 (tilted 45deg)]] | ||
|} | |} | ||
{| border="0" cellpadding="2" | {| border="0" cellpadding="2" | ||
| − | |+ | + | |+Resolution for chunks of drift distance |
| − | |[[Image: | + | |[[Image:run_31809_res3.png|thumb|x250px|run 31809 (horizontal)]] |
| − | |[[Image: | + | |[[Image:run_31811_res3.png|thumb|x250px|run 31811 (tilted 30deg)]] |
| + | |[[Image:run_31810_res3.png|thumb|x250px|run 31810 (tilted 45deg)]] | ||
|} | |} | ||
| − | |||
Latest revision as of 14:34, 20 July 2012
Cosmics, 50/50 gas, 2090V
Comparison with old (underpowered preamp) data is at CDC_signal_integration
Run numbers are 31809 (horiz) 31810 (45 deg) and 31811 (30 deg) at 3.0V, 2.09kV
Contents
- 1 Check pedestal width and stability
- 2 Find hit threshold to cut above noise
- 3 Try to calculate dE/dx
- 4 Same data as previous section with path lengths scaled by 1/cos(tilt angle)
- 5 Signal duration - Time over threshold
- 6 Signal duration - change in gradient
- 7 dE/dt without trackfitting?
- 8 Drift times
- 9 Resolution
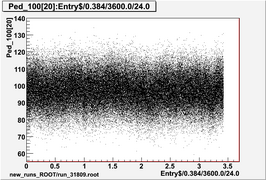
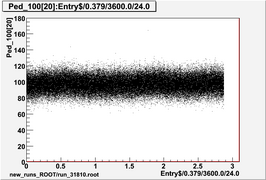
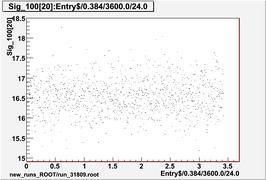
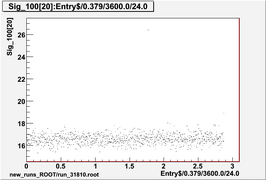
Check pedestal width and stability
Find hit threshold to cut above noise
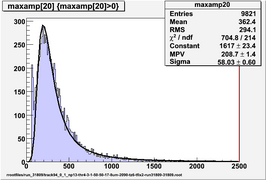
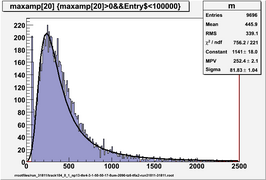
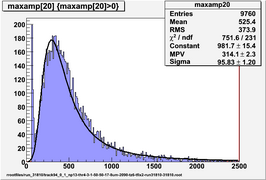
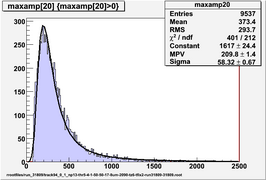
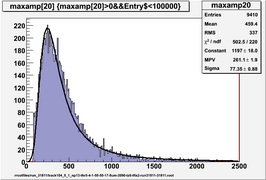
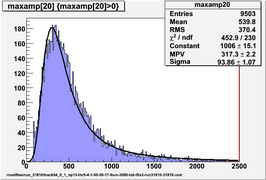
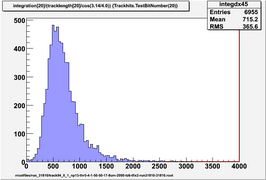
Ratio of fit MPV for horizontal : 30 degr : 45 degr data are 210 : 261 : 317 or 1 : 1.24 : 1.51 Ratio of vertical path lengths should be 1 : 1.15 : 1.41 or 1 : 1.16 : 1.45 after correcting for range of angles due to scintillator height and width.
Data below are for hit threshold 5 x pedestal sigma
Try to calculate dE/dx
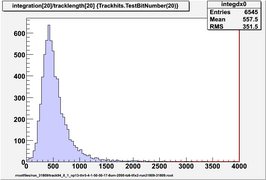
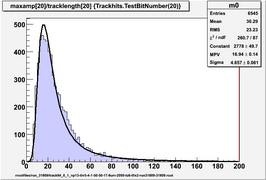
Find dE and then divide by track length (calculated in the plane parallel to the endplates). Results should scale with the tilt of the prototype. Try the following for dE:
- (A) integrate signal for 700 ns
- (B) position of first max in amplitude
- (C) integrate signal up to position of first max in amplitude
- (D) integrate signal up to end of signal (t0+720ns)
- (E) as (D) but subtract a linearly increasing pedestal which matches the ADC values at the start and end of signal
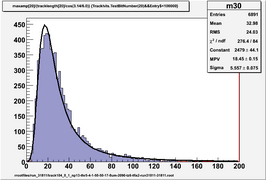
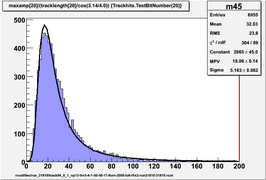
Ratio of fit MPV for horizontal : 30 degr : 45 degr data is 16.9 : 21.4 : 25.7 or 1 : 1.27 : 1.52 Ratio of vertical path lengths should be 1 : 1.16 : 1.45
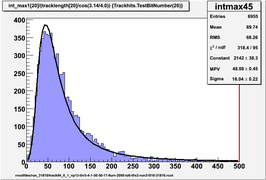
Ratio of fit MPV for horizontal : 30 degr : 45 degr data is 40.7 : 54.5 : 69.2 or 1 : 1.34 : 1.70
Same data as previous section with path lengths scaled by 1/cos(tilt angle)
Track length is calculated in the plane parallel to the endplates (no z information) so I scaled it by the tilt of the prototype for the 45 degree data, the upper cosmic trigger scintillator is high up enough that the cosmics are ~ vertical.
The ratio of tilted 45deg to horizontal integration means is 1.24 (old data) and 1.28 (new data); it should be 1 (as they are already scaled by track length) so this means the tilted integrations are 25-30% too large.
Landau fit MPVs are 16.9 (horizontal), 18.4 (30deg) and 18.1 (45 deg). Ratio of fit MPV for horizontal : 30 degr : 45 degr data is 1 : 1.09 : 1.07
Ratio of fit MPV for horizontal : 30 degr : 45 degr data is 40.7 : 47.3 : 48.1 or 1 : 1.16 : 1.18
Signal duration - Time over threshold
Look at time over threshold...
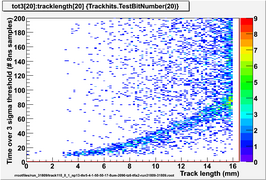
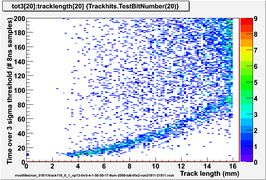
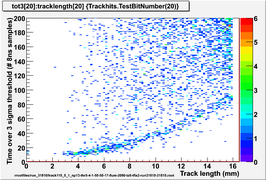
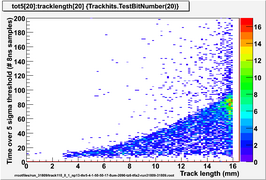
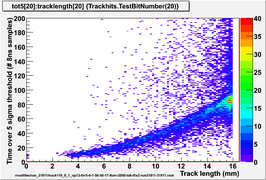
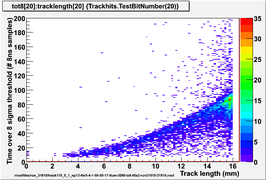
Search back from end of sample window until ADC value rises above a threshold, tried 3sigma, 5sigma, 8sigma (sigma= pedestal std dev). The initial hit selection is on 5sigma so all events will pass this.
Signal duration - change in gradient
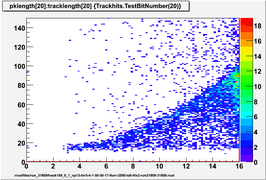
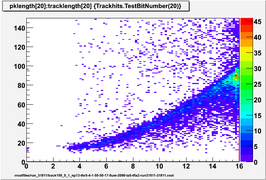
Another way to find the peak length is to start at the end of the sample window and work towards the first sample, looking for a rise of 10sigma or more between 2 consecutive chunks of 5 samples summed together. Other similar approaches on this page finding signal duration
