CDC
The new CDC page is Central Drift Chamber
Up to Charged Particle Tracking
|
|
|
Contents
The GlueX Central Drift Chamber
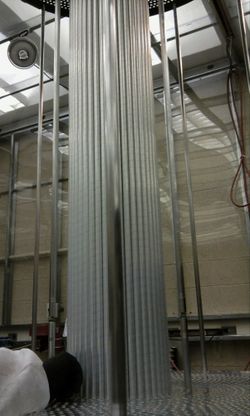
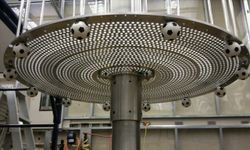
The CDC is a straw tube chamber that sits around the target in the GlueX experiment. The straws nominally run parallel to the beamline with readout on the upstream end of the chamber. About half of the straws are tilted with a 6 degree stereo angle to provide a measurement of the z position in two regions along the track. Tracks going more forward than about 30 degrees will also be tracked by the forward drift chamber system in the GlueX detector (FDC).
The 1.6 cm diameter straws are arranged in 28 radial layers. The inner-most layer is at about 10 cm and the outermost is at about 57 cm from the beamline. The chamber is anticipated to achieve a 150 micron position resolution in the r-phi plane, which when conbined with the stereo information will yield a number of z measurements with resolution of about a mm.
The most up-to-date description of the CDC is found in GlueX-document 990 which can be found on the portal http://portal.gluex.org . There are also up-to-date geometry tables in GlueX-document 979. There were also changes to this design that have been documents in GlueX-doc 744 and in document number 764 is the budget justification information for the chamber. All older documents should be considered out of date and probably inaccurate.
General information on charged particle tracking in Hall-D can be found on the Charged Particle Tracking wiki page.
The CDC is being built by the Medium Energy Physics group at Carnegie Mellon University http://www.cmu.edu . The current members of the CMU group involved in this effort are:
- ) Curtis A. Meyer cmeyer@ernest.phys.cmu.edu
- ) Gregg Franklin gbfranklin@cmu.edu
- ) Yves Van Haarlem yvhaarle@ernest.phys.cmu.edu
- ) Naomi Jarvis nsj@cmu.edu
- ) Gary Wilkin wilkin@ernest.phys.cmu.edu
CDC Construction
- CDC Fabrication Readiness Review (Pittsburgh, 21 October, 2010)
- Details of the CDC Construction
- Submitted Documents
- The documentation provided by CMU to Jefferson Lab as part of the CMU Contract Submission.
Fabrication Documentation
- Assembly documents
- Q&A Documents
Production Documents
Photographs
More on construction
- Preparatory work with straws
- GlueX-doc-1531 Comparison of CDC straws from different vendors
- CDC_Straw_Sag_photos
- Straw irradiation tests
Mechanical tests
With the cooperation of Tim and Slava we plan to do a couple of mechanical tests. During the review it was mentioned that we need to do more of these tests.
Measure the thickness of the Al inside the straw
Sag, compression, and twist test
Electrical hookup pics
Prototype studies
Simulations
dE/dx 350 MeV pions/kaons/protons
Old prototype
Photographs of the older, larger, CDC Prototype
New prototype
Energy/Amplitude as a function of drift time
Planned mechanical/construction tests
Tracking
Electronics
Measuring Fe-55 X-rays with %2 interposer board
ASIC design optimizations tests writeup
Preamp4 (GlueXdoc1364 Tbl 2 Row 2)
This section (blue background) contains links to data obtained when our gas mixer was not operating reliably.
On June 23, we came to the conclusion that our old preamplifier bit the dust. Detailed pictures showing how its performance has changed over the last several months are below. These clearly show that the gain increased by a factor of at least four and that there is substantially more noise. This later turned out to be confusion caused by a faulty mix of gas.
The following link points to comparisons of cosmic data taken with the old preamplifier several months ago and with the new preamplifier. They clearly show that the signals (for the same gas and voltage settings) are larger with the new preamplifier.
The following plots are taken using the new preamplifier with our FADC range decreased to match
the lower maximum output voltage from the new preamplifier (about 500mV). The old preamplifier
had a higher limit (~1V).
Based on the fact that our old preamplifier died, the following plots should not be used to make comparisons between the old and new preamplifier.
- Preamp 4 : Comparison of 'scope traces with earlier preamps
- Preamp 4: Comparison of 55Fe data with original preamp
- Preamp 4: Comparison of 55Fe data with original preamp at lower voltage
- Preamp 4: 55Fe 'scope traces at lower voltage
(end of dodgy gas section)
New HVB
Misc
CDC Documentation
- ) GlueX-doc-990 The GlueX Central Drift Chamber
- ) GlueX-doc-979 The CDC Design Layout
- ) GlueX-doc-1079 The CDC ASIC for GlueX
- ) GlueX-doc-1243 Gas Flow in the CDC

